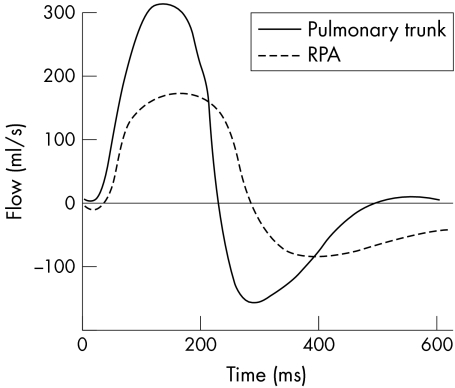
Figure 4 Plot of instantaneous flow versus time for the pulmonary trunk and RPA. Severe pulmonary incompetence is noted. The net forward flow for each vessel is calculated, and the percentage of net RPA forward flow to net pulmonary trunk flow gives the differential lung blood flow: right lung 65%, left lung 35%.

An official website of the United States government
Here's how you know
Official websites use .gov
A
.gov website belongs to an official
government organization in the United States.
Secure .gov websites use HTTPS
A lock (
) or https:// means you've safely
connected to the .gov website. Share sensitive
information only on official, secure websites.
