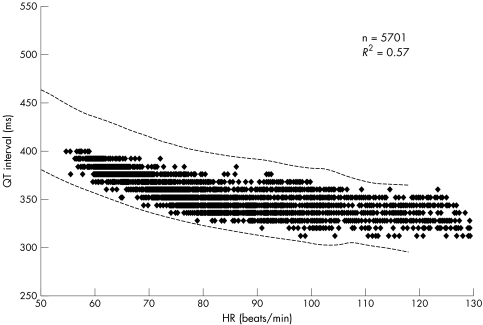
Figure 1 Representative relation of QT interval to heart rate (HR) during 24 hour Holter ECG recordings from a 50 year old healthy man. Number of data points was 5701 and correlation coefficient (r2) was 0.57. The dotted lines indicate the upper and lower limits of the normal QT interval (mean (2SD)) obtained from the nomogram (table 2). Almost all data points fell into the normal range.

An official website of the United States government
Here's how you know
Official websites use .gov
A
.gov website belongs to an official
government organization in the United States.
Secure .gov websites use HTTPS
A lock (
) or https:// means you've safely
connected to the .gov website. Share sensitive
information only on official, secure websites.
