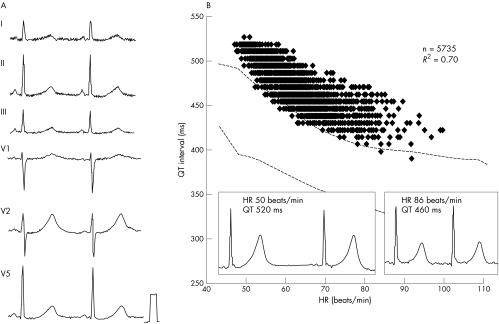
Figure 5 Representative surface ECG and the relation of QT interval to HR in a 37 year old woman with the long QT syndrome. (A) The broad based T wave and syncope during physical exercise suggested that this patient had long QT1. (B) In scatter plots of the relation between QT interval and HR, most of the data points fell above the upper limit of the normal QT interval (mean + 2SD).

An official website of the United States government
Here's how you know
Official websites use .gov
A
.gov website belongs to an official
government organization in the United States.
Secure .gov websites use HTTPS
A lock (
) or https:// means you've safely
connected to the .gov website. Share sensitive
information only on official, secure websites.
