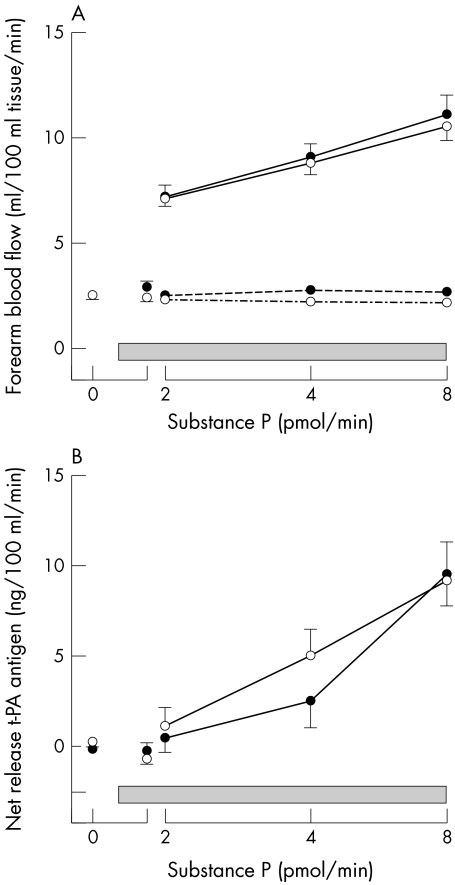
Figure 5 Infused (solid line) and non‐infused (dashed line) forearm blood flow (panel A) and estimated net release of tissue plasminogen activator (t‐PA) antigen (panel B) at baseline, during sildenafil (•) and matched placebo (○) infusion (shaded box), and subsequently with intrabrachial substance P (2, 4, 8 pmol/min) in patients with CHD. p < 0.01 analysis of variance for all, dose response for infused arm FBF and net t‐PA release.

An official website of the United States government
Here's how you know
Official websites use .gov
A
.gov website belongs to an official
government organization in the United States.
Secure .gov websites use HTTPS
A lock (
) or https:// means you've safely
connected to the .gov website. Share sensitive
information only on official, secure websites.
