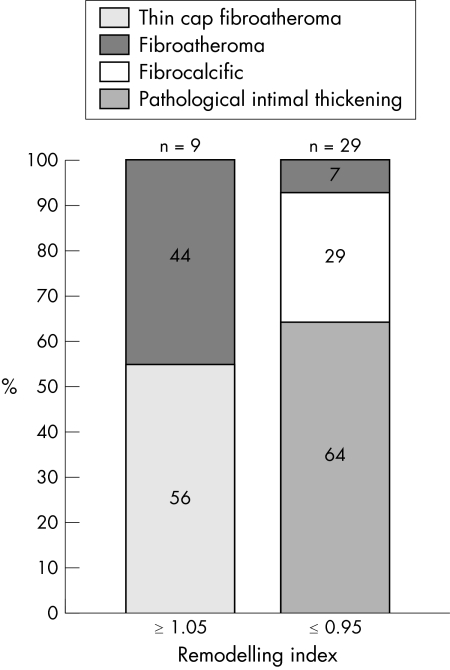
Figure 4 Bar graphs illustrating the lesion type frequencies according to remodelling modality. All of the high risk plaques had positive remodelling (56% were thin cap fibroatheroma and 44% fibroatheromatous lesions). Negatively remodelled lesions had a more stable phenotype, with 93% being low risk lesions and only 7% fibroatheromatous lesions.

An official website of the United States government
Here's how you know
Official websites use .gov
A
.gov website belongs to an official
government organization in the United States.
Secure .gov websites use HTTPS
A lock (
) or https:// means you've safely
connected to the .gov website. Share sensitive
information only on official, secure websites.
