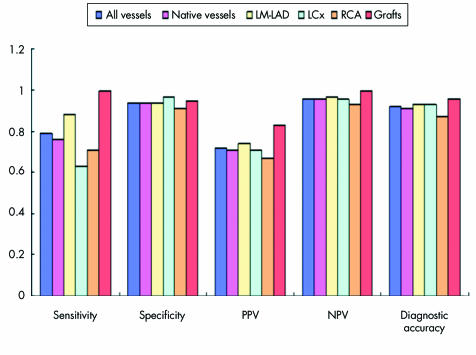
Figure 5 Bar graphs illustrating diagnostic measurements obtained by 32×0.5‐MDCTA in comparison with quantitative coronary angiography (QCA). Screening for 50% stenoses in all vessels combined, native vessels, LM‐LAD, LCx, RCA, and bypass grafts obtained the following results: sensitivity (34/43 (79%), 29/38 (76%), 14/16 (88%), 5/8 (63%), 10/14 (71%), and 5/5 (100%), respectively); specificity (207/220 (94%), 190/202 (94%), 75/80 (94%), 64/66 (97%), 51/56 (91%), and 18/19 (95%), respectively); positive predictive value (PPV) (34/47 (72%), 29/41 (71%), 14/19 (74%), 5/7 (71%), 10/15 (67%), and 5/6 (83%), respectively): negative predictive value (NPV) (207/216 (96%), 190/199 (96%), 75/77 (97%), 64/67 (96%), 51/55 (93%), and 18/18 (100%), respectively); and diagnostic accuracy (241/263 (92%), 219/240 (91%), 89/96 (93%), 69/74 (93%), 61/70 (87%), and 23/24 (96%), respectively).

An official website of the United States government
Here's how you know
Official websites use .gov
A
.gov website belongs to an official
government organization in the United States.
Secure .gov websites use HTTPS
A lock (
) or https:// means you've safely
connected to the .gov website. Share sensitive
information only on official, secure websites.
