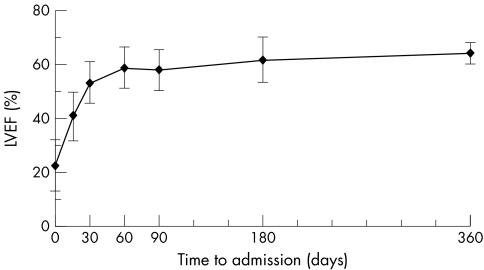
Figure 2 Evolution of mean left ventricular ejection fraction (LVEF) in survivors according to time after presentation. Plots represent mean LVEF and vertical lines represent the confidence intervals (mean (SD)). Measures of LVEF are given for admission and days 15, 30, 60, 90, 180 and 360 of evolution.

An official website of the United States government
Here's how you know
Official websites use .gov
A
.gov website belongs to an official
government organization in the United States.
Secure .gov websites use HTTPS
A lock (
) or https:// means you've safely
connected to the .gov website. Share sensitive
information only on official, secure websites.
