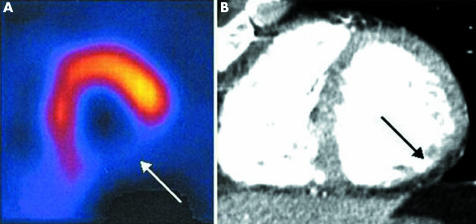
Figure 4 Example of a large perfusion defect on single‐photon emission computed tomography (SPECT) and multislice computed tomography (MSCT) of the same patient as in fig 3. (A) SPECT short‐axis image showing a perfusion defect in the inferior wall (arrow) at rest. (B) Corresponding MSCT short‐axis image in end diastole showing a hypoenhanced area (arrow) in the inferior wall, indicating a perfusion defect.

An official website of the United States government
Here's how you know
Official websites use .gov
A
.gov website belongs to an official
government organization in the United States.
Secure .gov websites use HTTPS
A lock (
) or https:// means you've safely
connected to the .gov website. Share sensitive
information only on official, secure websites.
