Figure 5.
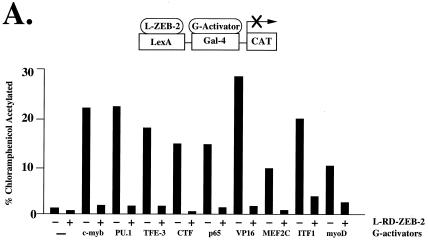
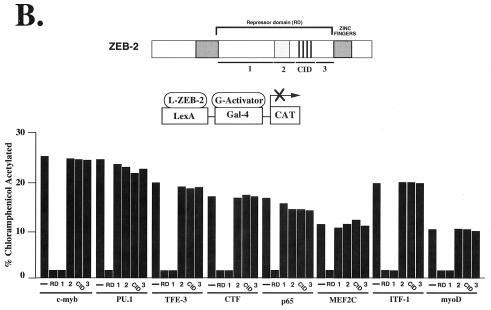
ZEB-1 and ZEB-2 have different transcriptional repressor specificity. (A) RD–ZEB-2 was fused to the DNA binding domain of the bacterial protein LexA (L-ZEB-2) and tested for its activity to repress various transcriptional activators fused to the DNA binding domain of Gal4 (G-activators). A total of 0.8 μg of the reporter pGL construct (16) containing LexA sites 30 bp upstream of Gal4 sites was cotransfected into C33a cells (293T cells in the case of G-myoD) with 2 μg of L-RD–ZEB-2 and 0.1–0.3 μg of different G-activators. After 36–48 h, cells were harvested and the CAT activity was determined as described in Materials and Methods. Equal molar amounts of the control LexA expression vector did not affect the activity of any of the different G-activators (data not shown). (B) Region 1 of ZEB-2 repressed transcription of several factors whereas others (e.g., MEF2C, PU.1) required the entire RD. Regions 1, 2, CID, and 3 of RD–ZEB-2 (indicated by numbers 1, 2, CID, and 3) were fused to the DNA binding domain of LexA and tested for their ability to repress transcriptional activators fused to the DNA binding domain of Gal4. A total of 0.8 μg of the pGL was cotransfected in C33a cells (293T cells in the case of G-myoD) with 2 μg of L-ZEB-2 constructs and 0.1–0.5 μg of different G-activators. After 36–48 h, cells were harvested and the CAT activity was determined. Equal molar amounts of the control LexA expression vector did not affect the activity of any of the different Gal4-activators (data not shown). Expression of all ZEB-2 regions was assessed by Western blot analysis to ensure equal levels of expression (data not shown). CAT results in this figure are an average of duplicate assays and are all representative of at least five separate experiments for each G-activator tested. In every case standard deviations were below 15%.


