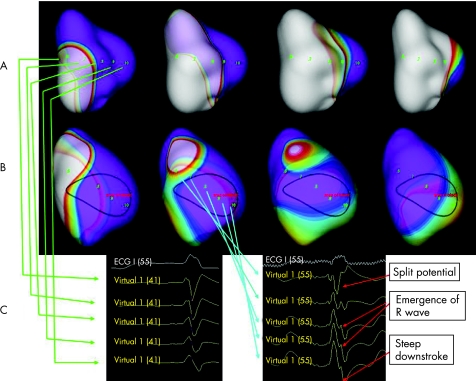
Figure 1 Non‐contact left ventricular (LV) mapping showing the two types of endocardial activation patterns. (A) (from left to right) Sequence of isopotential maps in a patient with type I LV endocardial activation pattern starting from the onset of QRS complex. There was no acute change in propagation direction and no line of block detected throughout the whole LV activation process. Note the propagation of depolarisation wavefront across the anterior wall, which was different from that of type II. (B) (from left to right) Sequence of isopotential maps in a patient with type II LV endocardial activation pattern starting from the onset of QRS complex. Area of conduction block was noted over the anterior wall of LV. Propagation wavefront splits when encountering the area of block and merges over the lateral wall.13 (C) (right) The conduction block was confirmed by the characteristic virtual electrograms defined as split potentials, gradual emergence of R wave and steep downstroke, which were different from the (left) virtual electrogram over the similar area in the patients with type I activation.14

An official website of the United States government
Here's how you know
Official websites use .gov
A
.gov website belongs to an official
government organization in the United States.
Secure .gov websites use HTTPS
A lock (
) or https:// means you've safely
connected to the .gov website. Share sensitive
information only on official, secure websites.
