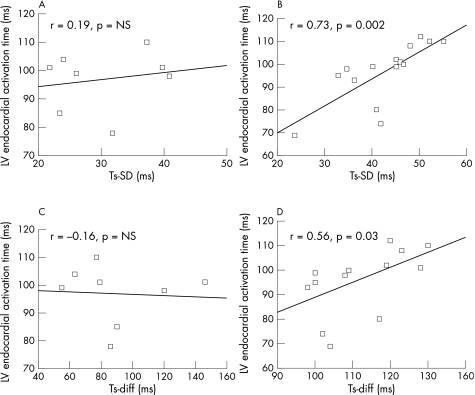
Figure 2 Relationship between total left ventricular (LV) endocardial activation time (Tat, y axis) and standard deviation (Ts‐SD, (A) for type I and (B) for type II) and maximal difference (Ts‐diff, fig (C) for type I and (D) for type II) of time to reach peak systolic contraction velocity in 12 LV segment by tissue Doppler imaging in patients with different activation patterns. NS, not significant; r, Pearson's correlation coefficient.

An official website of the United States government
Here's how you know
Official websites use .gov
A
.gov website belongs to an official
government organization in the United States.
Secure .gov websites use HTTPS
A lock (
) or https:// means you've safely
connected to the .gov website. Share sensitive
information only on official, secure websites.
