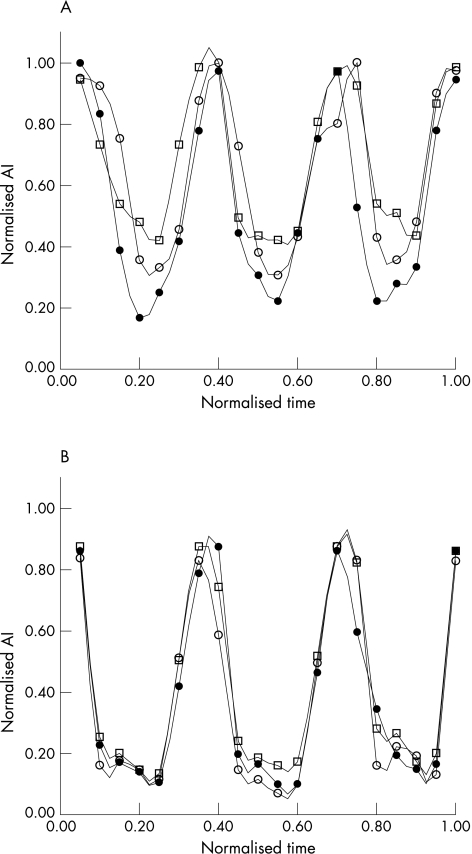
Figure 3 Phasic myocardial contrast echocardiography (MCE) signals obtained from the non‐collateralised (A) and collateralised (B) regions of the left anterior descending coronary artery perfusion bed on high mechanical index MCE performed at 15 Hz. See text for details. AI, acoustic intensity. Filled circle, no stenosis; open circle, mild stenosis; open square, moderate stenosis.

An official website of the United States government
Here's how you know
Official websites use .gov
A
.gov website belongs to an official
government organization in the United States.
Secure .gov websites use HTTPS
A lock (
) or https:// means you've safely
connected to the .gov website. Share sensitive
information only on official, secure websites.
