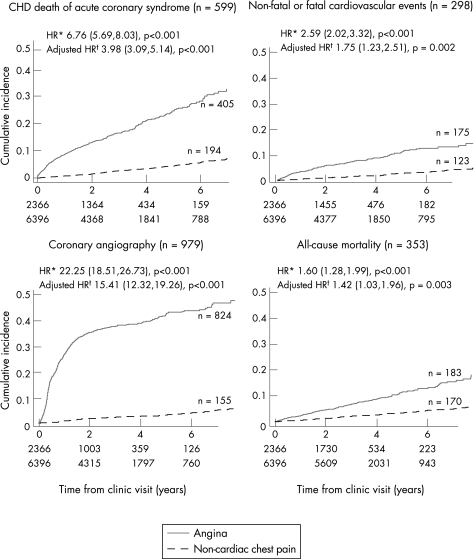
Figure 1 Kaplan–Meier survival curves for patients with and without angina. Numbers at risk at beginning of each year of follow‐up are displayed at the bottom of each graph. *Hazard ratio (HR) adjusted for age only. †HR adjusted for sex, age, ethnicity, diabetes, smoking status, heart rate, character of chest pain and resting ECG. CHD, coronary heart disease.

An official website of the United States government
Here's how you know
Official websites use .gov
A
.gov website belongs to an official
government organization in the United States.
Secure .gov websites use HTTPS
A lock (
) or https:// means you've safely
connected to the .gov website. Share sensitive
information only on official, secure websites.
