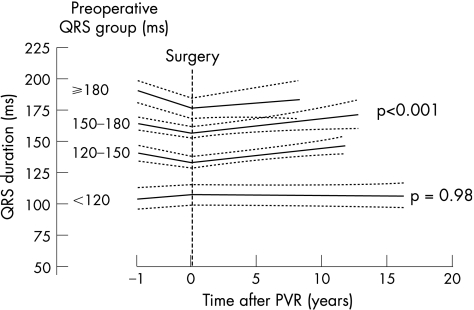
Figure 2 Change in QRS duration after pulmonary valve replacement is plotted with the 95% CIs, as analysed by mixed linear regression modelling. Patients were divided into four groups according to their preoperative QRS groups. When preoperative QRS was >120 ms, the average (SD) increase for all groups was 1.1 (1.3) ms/year (p<0.001) after surgery, whereas no increase was observed in patients with a preoperative QRS <120 ms (p = 0.98). A significant decrease was observed in patients with a preoperative QRS of 150–180 ms (mean decrease 9.9 (SE 4.3) ms; p = 0.021), and a preoperative QRS ⩾180 ms (mean decrease 12.2 (SE 2) ms; p<0.001) after surgery.

An official website of the United States government
Here's how you know
Official websites use .gov
A
.gov website belongs to an official
government organization in the United States.
Secure .gov websites use HTTPS
A lock (
) or https:// means you've safely
connected to the .gov website. Share sensitive
information only on official, secure websites.
