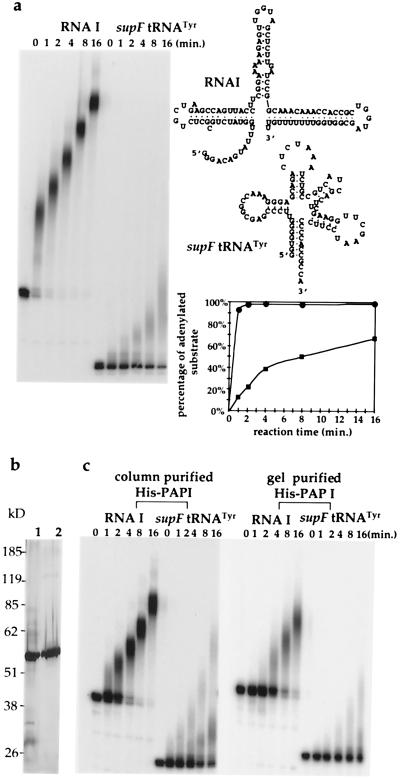
Figure 1.
Polyadenylation of GGG.RNA I and supF tRNATyr by PAP I in vitro. (a) Time course of reactions containing 1.2 pmol of GGG.RNA I or supF tRNATyr as substrates, using 1 μg of protein complex containing PAP I. Samples were taken at the times indicated. The secondary structure of GGG.RNA I and supF tRNATyr is as shown. The rate of initiation of polyadenylation was quantitated from gels by PhosphorImager analysis (Molecular Dynamics), and plotted for RNA I (●) and supF tRNATyr (■). The percentage of adenylated substrate at each time point was defined as follows: [1 − (the ratio of the quantity of nonadenylated substrate to the quantity of nonadenylated substrate at time 0)] × 100%. The adenylation initiation rate, which was defined as the time required for 50% of substrate to acquire one or more A residues, was 0.4 ± 0.1 min for RNA I and 8.0 ± 0.1 min for supF tRNATyr. (b) Purification of His-tagged PAP I is shown by silver nitrate staining SDS/PAGE analysis. Lane 1, eluate of His-tagged PAP I from Ni2+-immobilized metal affinity column; lane 2, same preparation further purified from SDS/PAGE. (c) In vitro polyadenylation reactions for GGG.RNA I and supF tRNATyr using 140 fmol of column-purified and gel-purified His-tagged PAP I.

