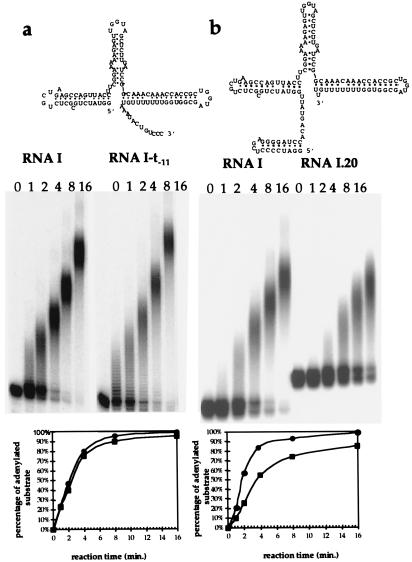
Figure 4.
The effect of 3′ end or internalized single-strand region in polyadenylation efficiency by PAP I. The reaction conditions were as in Fig. 1c, and 70 fmol of PAP I was used for each reaction. The corresponding secondary structure of RNA is as shown above each gel. (a) Polyadenylation of RNA I and RNA I-t−11. The initiation rate of adenylation is as plotted [RNA I (●) and RNA I-t−11 (■)]. (b) Polyadenylation of RNA I and RNA I.20. The initiation rate of adenylation is as plotted [RNA I (●) and RNA I.20 (■)].

