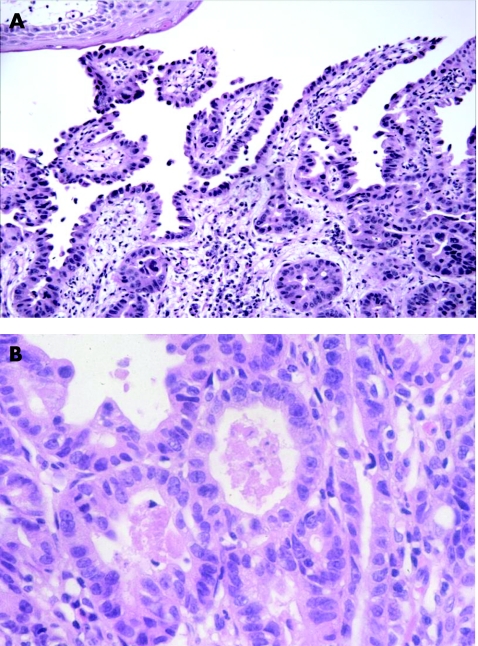
Figure 5 (A) Non‐adenomatous (high‐grade) dysplasia in Barrett's oesophagus. In contrast with adenomatous dysplasia, the neoplastic cells show low columnar or cuboidal phenotype, highly irregular nuclei with markedly increased nuclear/cytoplasmic (N/C) ratio and marked loss of cell polarity. High‐power view of another area from the same case (B) shows a back‐to‐back gland pattern consisting of cuboidal cells with a high N/C ratio, prominent nucleoli and marked loss of cell polarity.

An official website of the United States government
Here's how you know
Official websites use .gov
A
.gov website belongs to an official
government organization in the United States.
Secure .gov websites use HTTPS
A lock (
) or https:// means you've safely
connected to the .gov website. Share sensitive
information only on official, secure websites.
