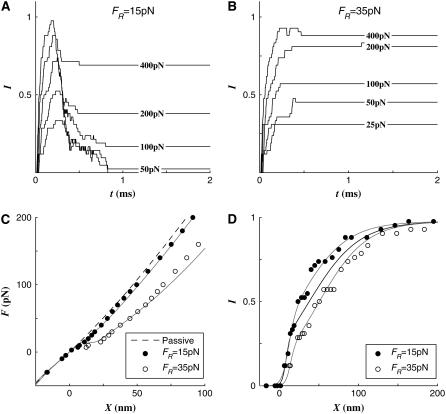
FIGURE 1.
Effect of resting tension (FR). (A) The activation I(t) curve when FR = 15 pN: The peak response is reached when t ∼ 0.25 ms. At small applied forces, a greater fraction of open channels closed again. (B) The I(t) curve when FR = 35 pN: The fast adaptation was not obvious. Most open channels remained open. (C) The F-X curve: The difference between active and passive F-X curves at F = 100 pN was 3 and 23 nm when FR = 15 and 35 pN, respectively. The dashed line indicates the passive F-X curve. (D) The I-X curve: As the resting tension increased the I-X curve shifted to the right. The blue line is the I-X curve when FR = 25 pN.

