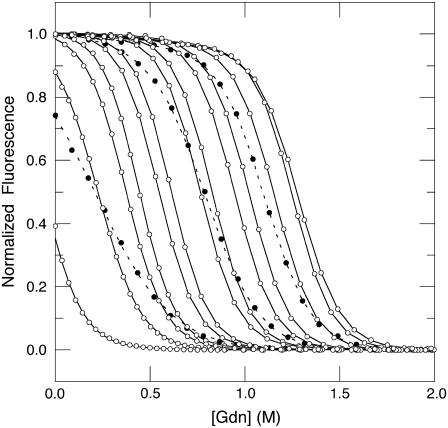
FIGURE 5.
GdnHCl titrations of Δ+PHS/V66D monitored by intrinsic fluorescence. Solid lines and open circles identify data from pH 10.5 to 4.5 in steps of 0.5 pH units (left to right). Dashed lines and solid circles refer to data from pH 3 to pH 4 (left to right). The lines represent fits to a two-state model of reversible denaturation. All measurements at 298 K, 100 mM KCl.

