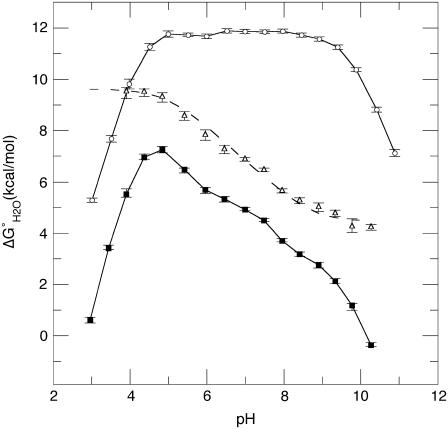
FIGURE 6.
pH dependence of stability ( ) measured by GdnHCl denaturation monitored by changes in intrinsic fluorescence for Δ+PHS (○) and Δ+PHS/V66D (▪) at 298 K in 100 mM KCl. The error bars shown are the errors of the fit for the individual denaturation experiments. Also shown is the difference in stability (
 ) between these two proteins (▵), shifted arbitrarily along the ordinate for display purposes. The dashed line through
  is the fit with Eq. 3.

