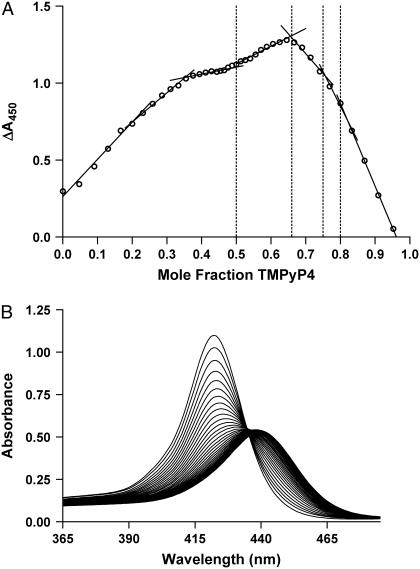
FIGURE 3.
(A) Job plot of difference spectra collected at 450 nm plotted against mole fraction of added TMPyP4. The linear regression intersections correspond to mole fractions of 0.5, 0.66, 0.75, and 0.8. These intersections represent binding stoichiometries of 1:1, 2:1, 3:1, and 4:1, respectively. (B) Plot of absorbance versus wavelength for incremental additions of TMPyP4 into 27-mer G-quadruplex oligonucleotide. Total solution concentration was kept constant at 32 μM throughout the addition of ligand. The plot shows a characteristic red shift from 422 nm to 440 nm consistent with an intercalative drug binding mechanism.

