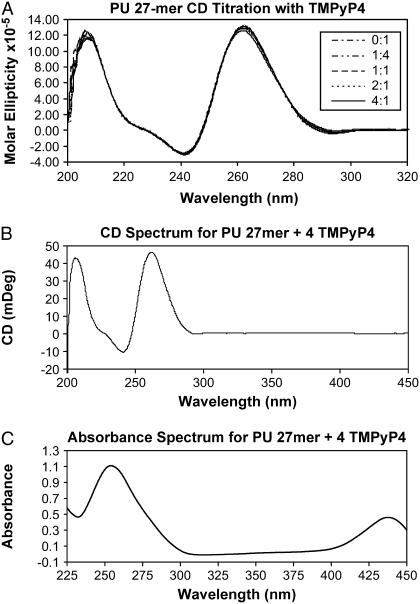
FIGURE 4.
(A) Circular dichroism spectra of the 27-mer quadruplex interacting with TMPyP4 in 100 mM KCl, 30 mM phosphate buffer, pH 7.0. The CD spectra for both the naked and the TMPyP4-saturated quadruplex show the characteristic maximum at 264 nm typical of parallel G-quadruplex DNA. (B) Circular dicroism spectrum for the TMPyP4 saturated c-MYC 27-mer with data collected out to 450 nm showing no induced CD for the drug at 440 nm. (C) Absorbance spectrum for the TMPyP4-saturated c-MYC 27-mer demonstrating attenuation of the absorbance peak for TMPyP4 consistent with intercalation of TMPyP4 into the c-MYC 27-mer structure.

