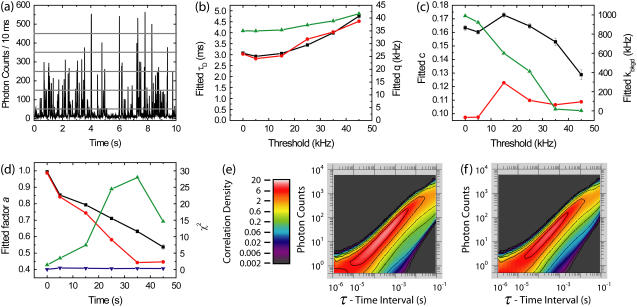
FIGURE 3.
Effects of burst search thresholds on fitted parameters obtained using purified FCS (PFCS) and purified PAID for simulations containing a single species. (a) Time trace of simulated fluorescence intensity with 10-ms time resolution. The burst search routine searched for consecutive time bins over a predetermined threshold. The five thresholds used are shown as horizontal shaded lines: 5, 15, 25, 35, and 45 kHz. In the following results, the points at the 0 kHz threshold are for the entire experiment. (b) Fitted τD using FCS (black), using PAID (red), and fitted q using PAID (green) as a function of burst search threshold. (c) Fitted c using FCS (black), using PAID (red), and fitted kbkgd using PAID (green) as a function of burst search threshold. (d) Fitted values for the correction factor a using FCS (black) and PAID (red). χ2 for FCS (blue) and PAID (green). (e) PAID histogram for entire experiment. (f) Purified PAID histogram for 15 kHz threshold.

