FIGURE 4.
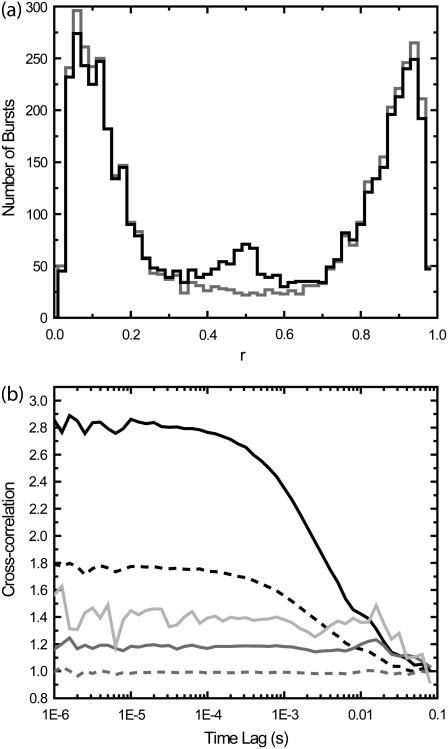
Effects of PFCS burst selection on cross-correlations. In the first set of simulations, there are two species that emit only in channels A or B, with no crosstalk. In the second set of experiments, a third, minor species depicting bound molecules of Species 1 and 2 was added that emits in channels A and B equally. (a) Histograms of the ratio r = IA/(IA + IB) calculated for each detected burst (similar to E histogram in Fig. 2), where IA and IB are detected intensities in channels 1 and 2. The first set of simulations without Species 3 is shown in shading, the second set with Species 3 is shown in solid representation. The peak near r = 1 is from Species 1, and the peak near r = 0 is from Species 2. The peak near r = 0.5 from the second set of simulations is from Species 3. (b) Cross-correlations obtained under various conditions. (Dotted shaded line) Standard cross-correlation for first set of simulations without Species 3. (Dark shaded line) PFCS on bursts with 0.3 < r < 0.7 are selected, and correlation regions are expanded by 100 ms. (Light shaded line) PFCS on bursts with 0.3 < r < 0.7 are selected, but correlation regions that also contain bursts with r < 0.3 or r > 0.7 are excluded. (Dotted dark line) Standard cross-correlation for second set of simulations with Species 3. (Solid line) PFCS on second set of simulations, bursts with 0.3 < r < 0.7 are selected.

