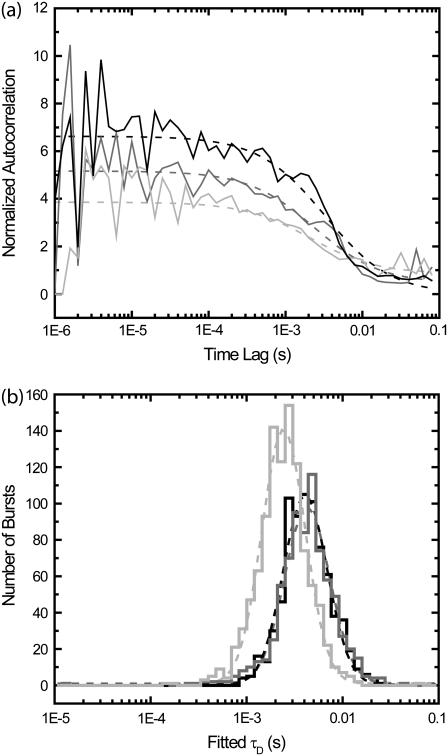
FIGURE 5.
Extracting diffusion times found by fitting correlations of small regions around individual bursts (100 ms on either side). (a) Examples of correlations of individual burst correlation regions. Solid lines are correlations; dotted lines are fits. (b) Extracted diffusion times. The simulation is the same as used in Fig. 1. The x axis is the fitted diffusion time, and the y axis is the number of bursts. Three histograms are shown; fits to log-normal distributions are shown as dotted lines of same color. (Dark shading) Fits for autocorrelations of channel D of bursts from Species 2 in Fig. 1. (Medium shading) Fits for autocorrelations of channel A of bursts from Species 2 in Fig. 1. For Species 2, the brightness in channel A is five-times smaller than in channel D. (Light shading) Fits for autocorrelations of channel A of bursts from Species 1 in Fig. 1.

