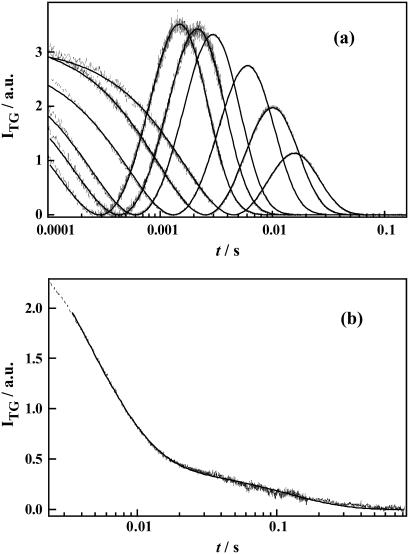
FIGURE 8.
(a) The TG signals (dashed lines) at various q2 in the molecular diffusion time range of D75N-ΔNpHtrII and the best fitted curves by Eq. 6 (solid lines) at q2 = 117, 78.7, 56.5, 26.1, 13.5, 6.78, and 2.17 × 10¹¹ m−2 (from left to right). (b) A typical TG signal (dotted line) at a low q2 condition (q2 = 2.5 × 10¹⁰ m−2). The best fitted curve by a biexponential function is shown by the solid line.

