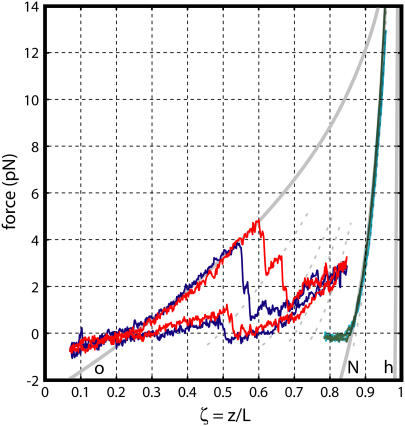
FIGURE 6.
Selections of data from the coiled-normal transformation of Fig. 5 (red and blue) and the normal-hyperextended transformation of Fig. 4 (green and cyan) superimposed on predicted elastic force-extension curves (solid gray) for coiled (o), normal (N), and hyperextended (h) polymorphic forms. Dotted lines are calculated curves for hybrid filaments containing (from left to right) 40:60, 65:35, 75:25, and 85:15 length fractions of coiled:normal filament, chosen to match the first four polymorphic transformations of the red data. These hybrid curves qualitatively match the progressively steepening sections of elastic stretching. Also shown is the calculated force-extension curve for 80:20 normal:hyperextended hybrid filament, chosen to match the polymorphic transformation of the green data. The deviation between data and theory for F < 0 is caused by filament buckling.

