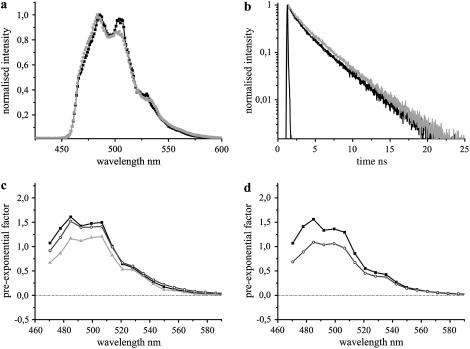
FIGURE 3.
The fluorescence emission dynamics of ECFP at 420 nm excitation in hippocampal neurons. (a) Comparison of fluorescence emission spectra of ECFP at DIV 7 (dark shading) with DIV 15 (light shading). The fluorescence maxima were observed at 486 nm, though a difference in the contribution of the second peak at 505 nm was observed. (b) Comparison of fluorescence decays of ECFP at DIV 7 (dark shading) with DIV 15 (light shading). IRF is shown in solid representation. The former was fit by a three-exponential model, whereas the majority of cells at DIV 15 displayed only two lifetimes (Table 1). (c) DAS of ECFP at DIV 7. Intensity decays were analyzed in 20 emission bands from 470 nm to 590 nm and the pre-exponential factors of lifetimes τ1 (solid), τ2 (shading), and τ3 (light shading) were plotted along the wavelength. (d) DAS of biexponential ECFP at DIV 15. The pre-exponential factors of lifetimes, τ1 (solid) and τ2 (shading), were plotted along the wavelength.

