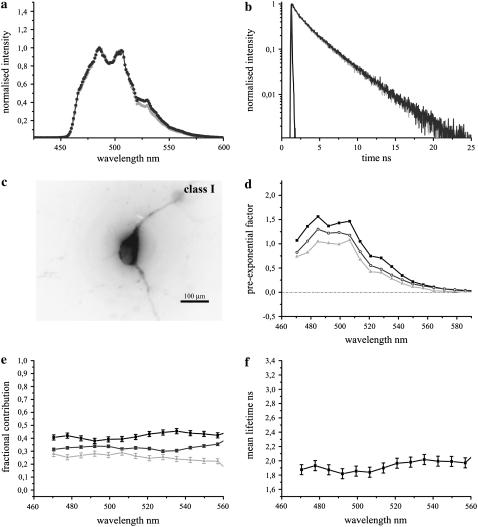
FIGURE 7.
The fluorescence emission dynamics of Clomeleon at 420 nm excitation in hippocampal neurons at DIV 7. (a) Comparison of fluorescence emission spectra of ECFP (light shading) with Clomeleon (shading) at DIV 7. (b) Fluorescence decay of Clomeleon at the donor emission maximum at DIV 7 (shading) compared to ECFP (light shading). IRF is shown in solid representation. The fluorescence decay of Clomeleon was fit by a three-exponential model (Table 2). (c) A representative image of a neuron at DIV 7. (d) DAS of Clomeleon at DIV 7. The pre-exponential factors of τ1 (solid), τ2 (shading), and τ3 (light shading) were positive similar to ECFP. (e) The contributions of the lifetimes τ1 (solid), τ2 (shading), and τ3 (light shading) were calculated and plotted as normalized fractional contributions along the wavelength. (f) The mean lifetime of each emission band was plotted along the wavelength. The variability between the cells is shown by error bars. The mean lifetime of Clomeleon at the donor emission maximum was similar to that observed for ECFP.

