Abstract
Introduction
A study was designed to assess variability between different fluorescence spectroscopy devices. Measurements were made with all combinations of three devices, four probes, and thee sets of standards trays. Additionally, we made three measurements on the same day over two days for the same combination of device, probe, and standards tray to assess reproducibility over a day and across days.
Material and Methods
The devices consisted of light sources, fiber optics, and cameras. We measured thirteen standards and present the data from: the frosted cuvette, water, and rhodamine standards. A preliminary analysis was performed with the data that was wavelength calibrated and background subtracted however the system has not been corrected for systematic intensity variations caused by the devices. Two analyses were performed on the rhodamine, water, and frosted cuvette standards data. The first one is based on first clustering the measurements and then looking for association between the 5 factors (device, probe, standards tray, day, measurement number) using chi-squared tests on the cross tabulation of cluster and factor level. This showed that only device and probe were significant. We then did an analysis of variance to assess the percent variance explained by each factor that was significant from the chi-squared analysis.
Results
The data were remarkably similar across the different combinations of factors. The analysis based on the clusters showed that sometimes devices alone, probes alone, but most often combinations of device and probe caused significant differences in measurements. The analysis showed that time of day, location of device, and standards trays do not vary significantly; whereas the devices and probes account for differences in measurement. We expected this type of significance using unprocessed data since the processing corrects for differences in devices. However, this analysis on raw data is useful to explore what combination of device and probe measurements should be targeted for further investigation. This experiment affirms that online quality control is necessary to obtain the best excitation-emission matrices from optical spectroscopy devices.
Conclusion
The fact that the device and probe are the primary sources of variability indicates that proper correction for the transfer function of the individual devices should make the measurements essentially equivalent.
Keywords: fluorescence spectroscopy devices, quality assurance, trial design, probe, Fast EEM, standards
1. Introduction
One of the big concerns in the use of modern biomedical devices is the repeatability of measurements across devices and within the same device across time. Our team has been working on the use of fluorescence spectroscopy for the detection of cervical neoplasia. The study was carried out at two sites in Houston and one in Vancouver. We have built three different devices for use in the project. Over the course of the project we have tested and used four probes. Each device has its own tray of standards. The study was designed to measure 13 standards, and we also wanted to be sure that the standards trays used for calibration quality assurance were equivalent from site to site. Additionally, we believed that there may be variation from day to day and variation within a day, e.g. from warm-up. Because we have seen substantial differences in the probes, and because it was relatively easy to swap probes among devices, we decided to assess the variability that was due to the devices, probes, standards, days, and hours in the day
Therefore, we designed a study to assess each of these 5 factors (device, probe, standards tray, measurement day, and measurement number within the day). Measurements were made at all combinations of these 5 factors. Here we report the study design, analysis of summary measurements of normalized but unprocessed data, and significance of the five factors in explaining variability.
2. Materials and Methods
2.1: The use of spectroscopic measurements
Fluorescence spectroscopy consists of putting light into the tissue (excitation illumination light), and collecting the emitted fluorescent light measured at longer wavelengths than the excitation light. The excitation light is filtered so that it is concentrated very near a single wavelength (the excitation wavelength). Our device utilizes 24 excitation wavelengths ranging from 300 nanometers (nm) to 530 nm in increments of 10 nm. The wavelength of fluorescence light coming back into the device is referred to as the emission wavelength. The range of emission wavelengths varies with the excitation wavelength. The intensity of fluoresced light is measured then at each excitations-emission wavelength combination, and then normalized with the intensity of the excitation light. The fluorescence in tissue comes from several biologically relevant fluorophores including NADH, FAD, tryptophan, and collagen. The measured fluorescence intensity also indicates absorption, particularly from hemoglobin. There has been some success using fluorescence spectroscopy to detect cancer and pre-cancer [1–5]. One of the important issues in the successful implementation of any spectroscopic device is the proper calibration and the control of extraneous variation. Control of these difficulties in spectroscopy had depended to a great extent on the measurement of standards. Fluorescence standards are of two general types: positive standards which actually fluoresce and have a well known fluorescence spectrum, and negative standards which have very little fluorescence.
2.2: The spectroscopic instrumentation
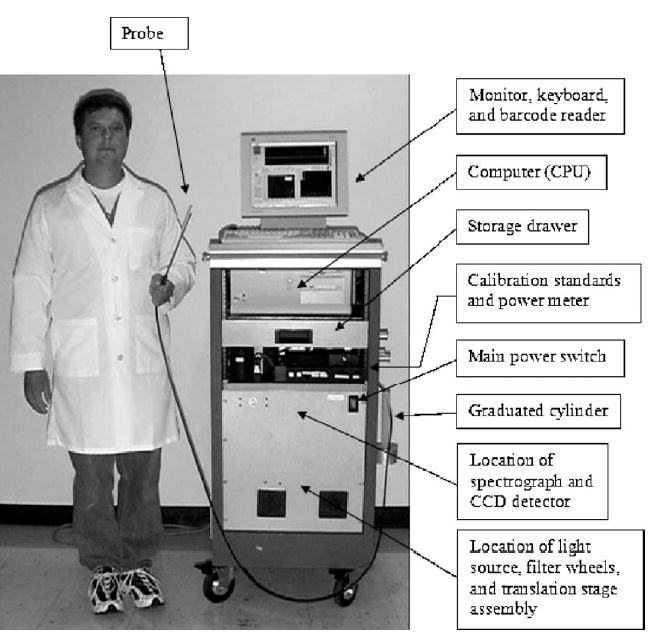
The Fast Excitation Emission Matrix (FastEEM) system incorporates a xenon arc lamp coupled to a filter wheel to provide excitation light, coupled to a fiber-optic probe to conduct the excitation light to the tissue/sample and the emission light back to a second filter wheel, from which the emission light passes through to an imaging spectrograph/cooled charge-coupled device (CCD) camera to record fluorescence intensity as a function of emission wavelength. Combinations of neutral density filters control the illumination level. Fluorescence emission light is collected by the fiber-optic probe and coupled into a scanning imaging spectrograph fitted with a high-sensitivity CCD array. The fiber optic probe is approximately 24 cm in length and 5 mm in diameter at the tip. It is attached to the FastEEM unit by a fiber optic cable approximately 2 meters in length. All components of the system, as well as the measurement procedure, are controlled by the computer built into the instrument. The software that control each component is FastEEM v.0.4.1, based on LabView v. 7.0.1 (National Instruments) script, and data is collected and saved after each measurement. Figure 1 is a cartoon of the FastEEM device showing its components and Figure 2 shows the actual device.
Figure 1.
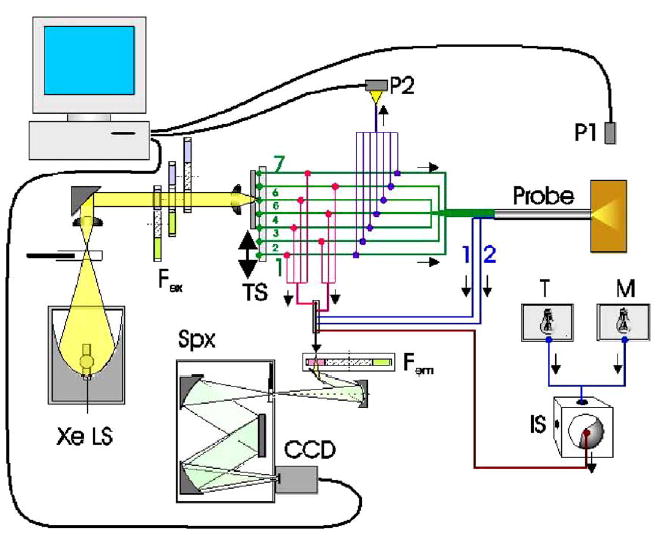
Figure 2.
2.3: Standards measured in the study
The standards tray contains different fluorescence and reflectance standards that were integrated into the system and used throughout the trial. Positive fluorescence standards include Exalite, Coumarin, and Rhodamine. Negative fluorescence standards are deionized ultrafiltered water and the frosted quartz cuvette. Positive reflectance standards are microspheres, teflon, and an integrating sphere of 99% reflective Spectralon. There is only one negative reflectance standard which is a black 2% reflective Spectralon sample. Three different calibration light sources include Mercury-Argon lamp (M), Deuterium-Halogen lamp, and a Tungsten lamp (T) to calibrate the wavelength and spectral sensitivity. For the purpose of this study only the results on rhodamine, frosted cuvette, and water are reported.
The data were processed by (1) calibrating the wavelength using the Mercury-Argon lamp, with an additional wavelength offset correction estimated from the closest (in time) rhodamine measurement; (2) adjusting the intensity for the exposure time and power meter measurement; and (3) subtracting the background. These data were not processed to the same extent as we would have for tissue measurements because we were examining the data to determine which devices, probes, standards, measurement days, and times of day might need different processing. A future manuscript will describe the same experiment using data processed for device differences.
2.4: Study design
Figure 3 shows a schematic of the study design. As indicated in the figure, there were 3 devices, labeled FEEM_3(1), FEEM_3(2), FEEM_3(3). Each of the devices is in a different location: FEEM_3(1) is located at the Colposcopy Clinic of the University of Texas M. D. Anderson Cancer Center in Houston, Texas; FEEM_3(2) is located at the Lyndon B. Johnson (LBJ) County Hospital in Houston, Texas; and FEEM_3(3) is located at the Colposcopy Clinic of British Columbia Cancer Agency in Vancouver, British Columbia, Canada. The devices are large and difficult to move, so we left them in their respective locations and brought all other materials to them. The Standards Trays are located at each of the 3 sites, but we shipped them between or hand-carried them, as appropriate, to the other sites. Also the probes were generally attached to particular devices, but we disconnected and shipped them between sites. There were 2 probes for the M.D. Anderson device FEEM_3(1) because one (Probe 1) was being replaced with a newer one, Probe 2. Every probe, standards tray as well as the standards themselves were labeled prior to conducting the study.
Figure 3.
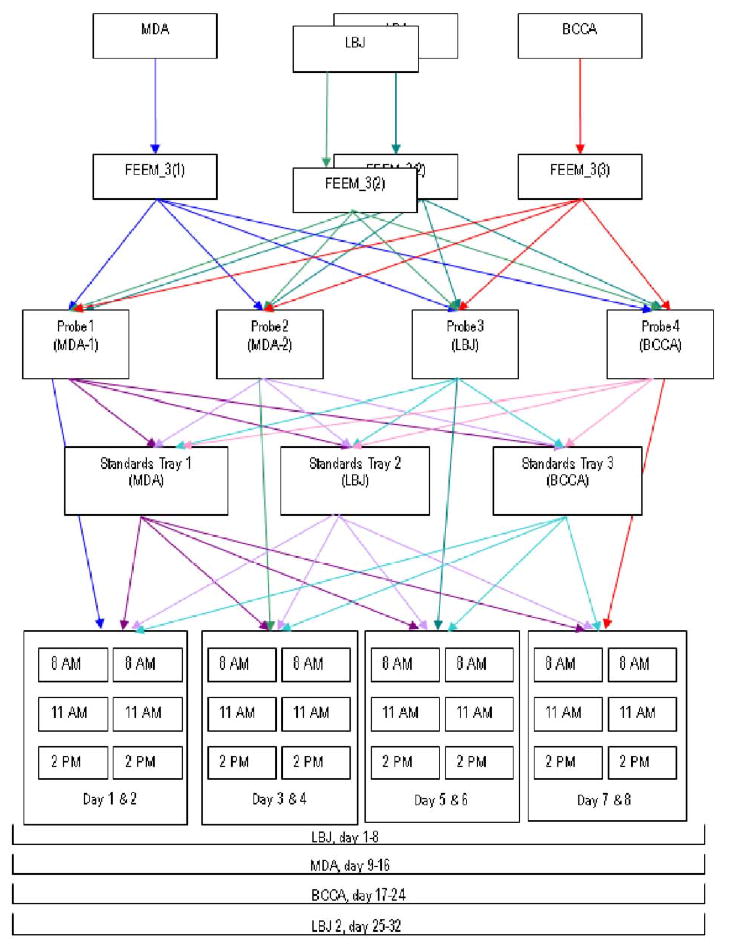
We made measurements using each of the 3 FastEEM devices for every possible combination of 3 standards trays and 4 probes. Additionally, the first set of measurements at LBJ was repeated at the end of the experimental period. Figure 3 shows a schematic presentation of the experiment. Measurements were made over 2 days for each Device-Probe combination, cycling through the three standards trays 3 times in each day (at 8am, 11am and 2pm). Each probe on each device, generated 6 sets of measurements over two days. Since the six measurements were of each of three standards trays, 18 measurements were taken over the 2 day period, for each probe/device combination. In order to complete this study, the operators stood in the dark for 8 days at each of the sites and then 8 more days to repeat the LBJ measurements. This experiment took 32 days to complete. In summary,, there were a total of 4 (3 devices + repeat of LBJ) × 3 (standards trays) × 4 (probes) × 2 (days) × 3 (measurements within days) = 288 measurements made on each of the 13 individual standards (3744 total measurements). In order to minimize the bias, two people conducted all of the experiments; one person measured each standard and one person attended to data collection and file naming. A method was devised to ensure that the distance from probe tip to the each of the standards was the same in all cases. The measurements were kept in the same order when interchanging the standards trays: Standards Tray 3 → Standards Tray 2 → Standards Tray 1. Every measurement was timed and recorded into a log file along with detailed descriptions of any problems which were encountered.
The device was turned on early in the morning, and the room lights were turned off throughout all measurements. There was a wait time of approximately 30 minutes while the xenon lamp and tungsten lump warmed up, and the CCD temperature dropped down to −28°C. After this the operator proceeded with measurements, using the preprogrammed scripts with integration time adjusted to fit the probe/FastEEM combination.
The operator followed the screen prompts, and ran the “Standards script” through a fixed series of measurements on calibration standards. The fibers of the probe were checked for proper illumination, and CCD background was taken. The standards were taken in the following order: Tungsten and its background, Deuteruim-Halogen lamp, Mercury-Argon lamp. The Integrating Sphere, Frosted Cuvette, and Black 2% Reflectance Spectralon measurements were acquired then, since they are considered “dry” standards. The Water standard and those that follow it: Exalite, Coumarin, Rhodamine, Microspheres, and Teflon, are considered “wet” standards, since they must be dipped into water prior to contacting cuvettes. Following this series of measurement, the standards trays were switched, and measurements repeated. After all 18 sets of standards were run (two days if everything ran smoothly), the next probe was installed, focused and aligned to the FastEEM.
2.5: Statistical methods
An initial data analysis was performed which consisted of looking at plots of all of the measured spectra. As there were several hundred spectra measured, we performed this by putting a large number of plots on a single page and quickly scanning for spectra that stood out. This was done to identify obvious problems including cases where there was an obvious failure. The portions of spectra or entire spectra identified in the initial data analysis as defective were deleted from all further analyses.
We used two approaches to the more formal preliminary statistical analysis reported here. In the first approach, we separated the measured spectra into groups using a clustering algorithm, then performed statistical tests to see if any of the factors was associated with the cluster groups. This was done because initial data analysis (looking at plots of the measured spectra) suggested that there were certain groups of spectra. The initial data analysis also indicated that there were several spectra for each standard that were obviously defective, and these were deleted from further analysis. The second analysis was based on Analysis of Variance (ANOVA), including Multivariate ANOVA, and allowed us to quantify the contribution of each factor as a main effect in terms of the proportion of variance explained, and to determine if the factor was a statistically significant source of variation.
All statistical analyses were performed in Matlab or R (available for free from http://cran.r-project.org/).
2.5.1: Cluster analysis
We used the k-means clustering algorithm to subdivide the measurements into groups [6]. Given that the desired number of groups or clusters is k, the algorithm finds the best way of subdividing the data set so as to minimize the sum across clusters of the sum within clusters of the squared distances to the center (mean) of the cluster. It is useful because the algorithm is very fast and no assumptions are made about the nature of the clusters. However, there is no widely accepted method for choosing the number of clusters. Our approach was to look at the plots of the means within clusters for each value of k, k ranging from 2 to 10, and then choosing a cluster size k such that there was not much change in going from k to k+1 clusters. In order to assess any correspondence between clusters and the levels of the factors, we performed cross tabulations between the clusters and the levels of each factor and used chi-squared tests of statistical significance. If significance was found in any cross-tabulation, we computed Pearson residuals to determine which cells in the table deviated significantly[7]. Since the clusters were computed without any use of the levels of the factors, this method of statistical inference is considered valid.
2.5.2. ANOVA Analysis
The other type of statistical was based on ANOVA. The first objective was to perform a MANOVA including the main effects from all factors[6]. However, since the data are hyper-dimensional (each observation has over 4,000 intensity values), one cannot perform a MANOVA on the raw data as the estimated covariance matrix will be singular. To eliminate this problem, we first performed a Principal Components Analysis (PCA) and kept the first 10 components. This reduced the data sufficiently that MANOVA could be performed. Any factors that were found significant were kept for a second stage of the analysis wherein we performed ANOVA on each of the principal component scores to find the percentage of variability explained by each of the significant factors. Then, we computed an overall percentage of variance explained for each significant factor as a weighted average of the percentage of variance explained across the principal components using as weights the percentage of variance corresponding to the principal component.
3.0 RESULTS
3.1 Operator reports
Not everything ran as smoothly as planned, and we encountered several problems throughout the experiment. The experiment was begun at LBJ Hospital and after completing the first trial it appeared that there were may be inconsistencies in the data. After the measurements were made at the other two sites, a second round of measurements was made at LBJ Hospital. During this second round at LBJ the shutter board and later on the shutter itself failed and needed to be replaced. The failure was detected because the power meter measurements became negative, and the graph of the power meter measurement versus time appeared to be invalid to the operator. There was also an issue of the shutter being overheated by the xenon light source which is located very near the shutter. Table 1 shows the operator records recorded at the time of the failure. These unexpected mechanical problems were corrected. The shutter board was replaced, the shutter changed, and measurements completed.
Table 1.
Operator report for Day 26 when there was a shutter failure.
| Date | Time | Measurement No. | Standards Tray | Comments/Problems |
|---|---|---|---|---|
| 07-01-04 | 5:25–6:53 | 0 | BCCA | HgAr lamp showed no signal. The Y-cable was transmitting very little light. Switched to original LBJ Y-cable, signals normalized. Erased extra aquired data. Proceeded with measurements. Occasional ackward powermeter. Shutter not opening during Exalite, Cumarine, etc. |
| 6:55–7:38 | 1 | LBJ | Lambda12changeall.vi error during IS. Powermeter shape=∧ occasionally. | |
| 7:41–8:36 | 2 | MDA | Very ackward powermeter - ∧ during null standards. Stopped acquisition after H20. |
Notes: The shutter completely stopped opening. No further measurements taken, due to mechanical downtime. (replacement of faulty lamp shutter controller board)
Other problems encountered during the study included broken fiberoptic Y-cable that carries signal to the HgAr lamp. This probably occurred since the HgAr lamp was frequently reattached. Accidents also happen to the standards trays. The microsphere standards cuvette broke and had to be replaced to obtain consistent values. We have always kept an instrument log file, so that all the technical issues that arise with the probes, devices, standards trays, calibration, and measurements can be reviewed.
3.2 Initial data analysis
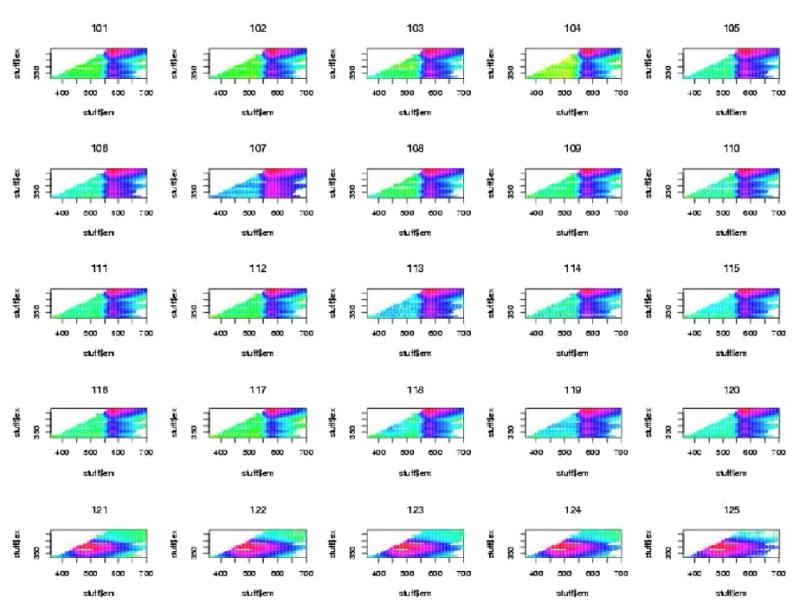
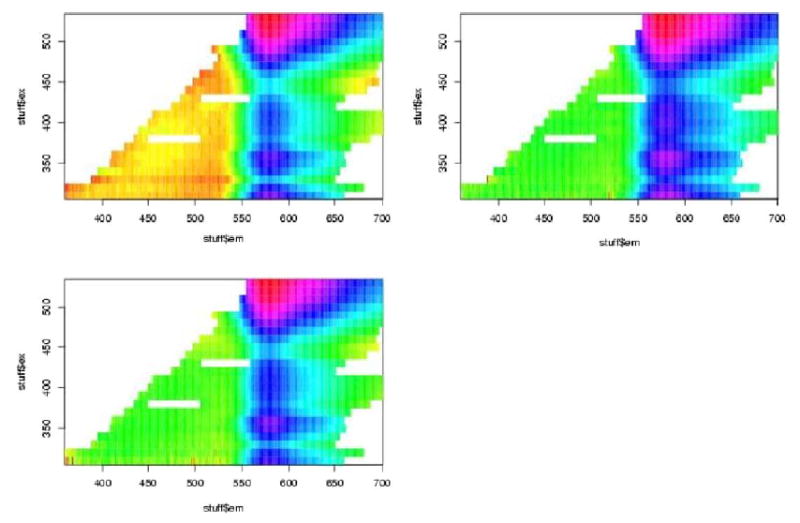
The initial data analysis showed that a large number of all the spectra showed very bright segments at either excitation wavelengths 380 nm or 430 nm. It was determined that these resulted from filter leakage wherein excitation light was leaking back into the emission spectrum. These regions were deleted and the plots were done again. One will notice the blank regions at these excitation wavelengths for all plots. For all subsequent plots of Excitation-Emission Matrices (EEMs), the excitation wavelength is on the vertical axis and the emission wavelength is on the horizontal axis. Figures 4, 5, and 6, show examples of “contact” sheet plots of twenty five fluorescence spectra. These two contact sheets were selected because they exemplify the two problems that we discovered which lead to the deletion of spectra. One notices in figure 5 that there are six H2O spectra that are clearly different from the rest beginning with the last three spectra in row three. It is believed that these resulted from an improper wavelength calibration. In the contact sheet of rhodamine spectra (figure 6), the entire bottom row looks like something other than a rhodamine spectrum (which has an intense vertical band centered on 580nm emission wavelength). It was determined that the coumarin cuvette had inadvertently been inserted in the slot for rhodamine. The bad spectra discovered at this stage were deleted from all further analyses. These included 8 spectra for H2O, 9 spectra for frosted cuvette, and 22 spectra for rhodamine.
Figure 4.
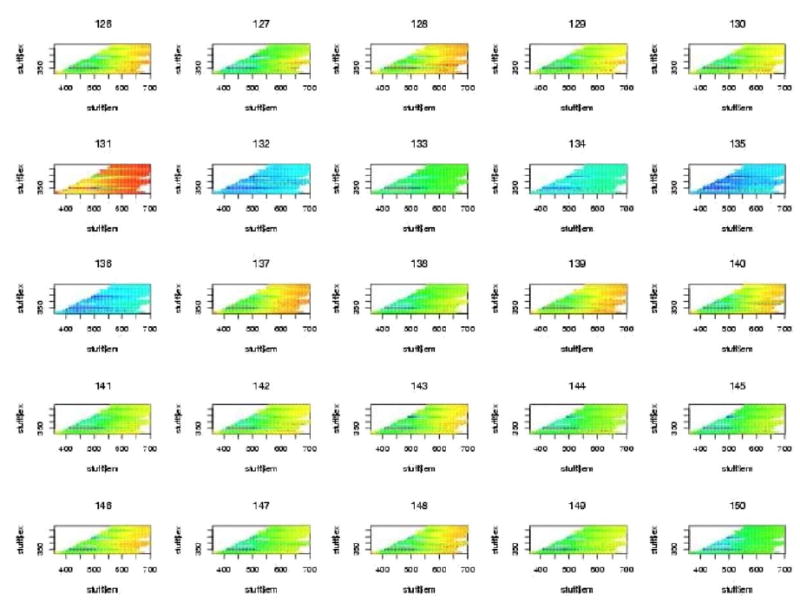
Figure 5.
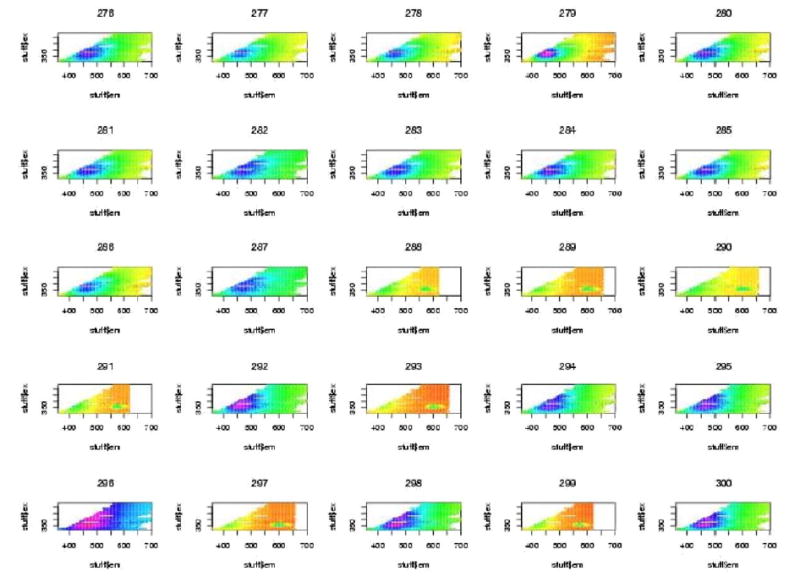
Figure 6.
3.3 Analysis based on clustering
In figures 7 to 12 are shown the pivotal plots used to select the number of clusters k for the k-means clustering algorithm. For the frosted cuvette, we selected k=4 clusters. One notes that the bottom 2 plots in figure 6 do not look very different from the bottom plot in figure 8, suggesting that little has been added with the additional cluster going from k=4 to k=5. For H2O, we concluded that k=5 was about right, as seen in figures 9 and 10. For Rhodamine, we decided to go with k=3, as seen in figures 11 and 12. Thus we were fairly certain we had chosen the correct number of clusters to examine further for significant effects of the device, probe, or interaction of the two.
Figure 7.
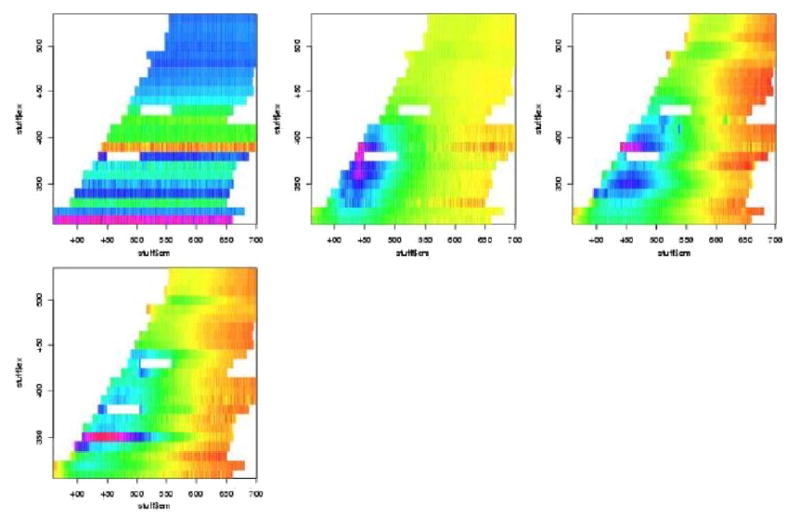
Figure 12.
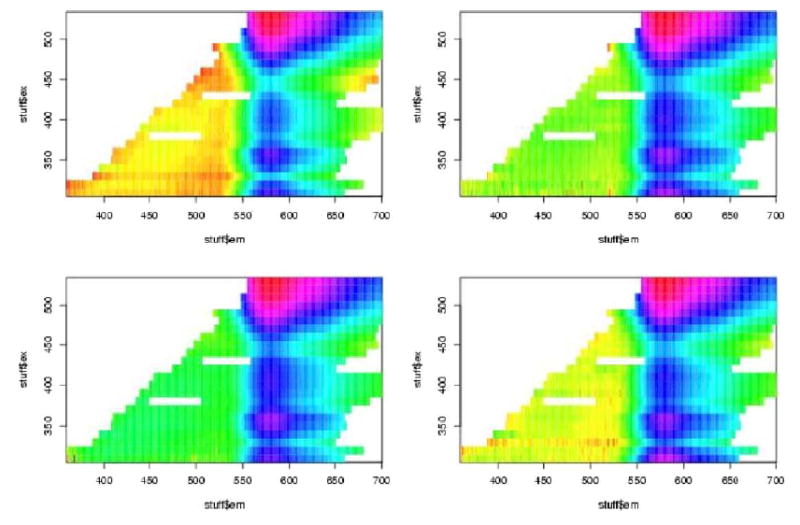
Figure 8.
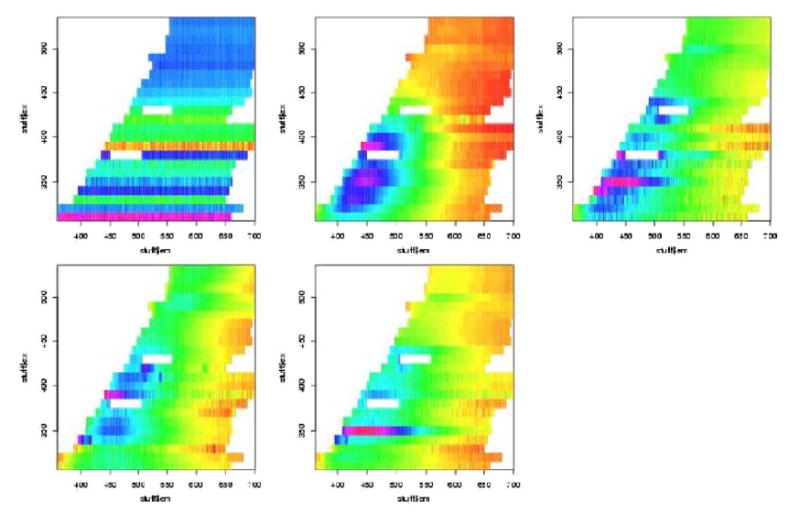
Figure 9.
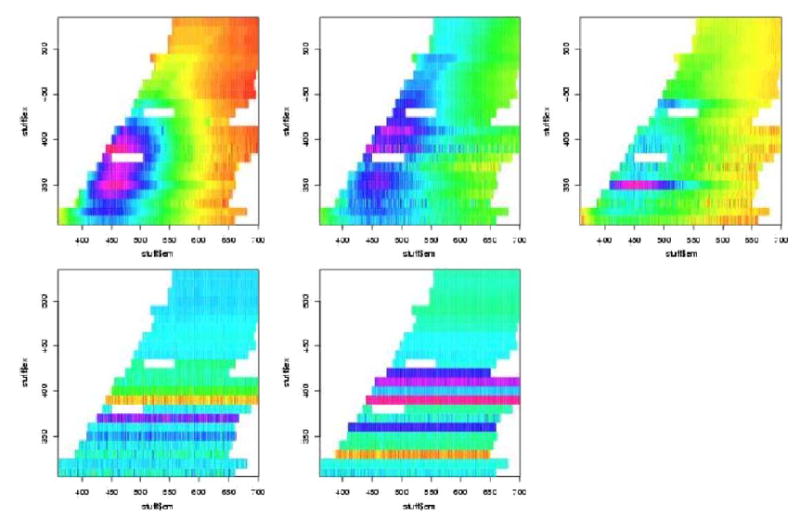
Figure 10.
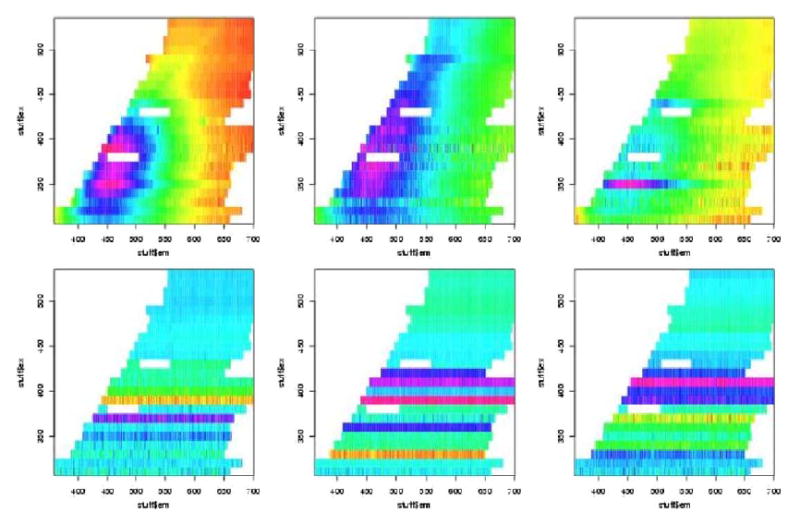
Figure 11.
We next performed contingency table analyses of the clusters with the levels of the factors. The overall p-values for the chi-squared tests are summarized in table 2. We see from this that there were highly statistically significant associations between the various Fast-EEM devices and the various probes for each of the three standards, but there were not significant differences amongst three trays of these standards, nor were there significant differences by day of measurement nor by times of measurement in the daytime (8am, 11am, 2pm).
Table 2.
P-values for the chi-squared tests of association between the levels of the factors (Fast-EEM Box, Probe, Standards Tray, Day of Measurement (1 or 2), and Measurement Number within day (1, 2, or 3)). The chi-squared test statistic was computed from the cross tabulation of the factor levels with the cluster membership for the clusters computed for each of the three standards which label the columns of this table.
| Frosted Cuvette | H2O | Rhodamine | |
|---|---|---|---|
| Fast-EEM Box | < 2.2e-16 | < 2.2e-16 | < 2.2e-16 |
| Probe | < 2.2e-16 | 8.839E-12 | < 2.2e-16 |
| Standards Tray | 0.4577 | 0.5492 | 0.7701 |
| Day | 0.8344 | 0.8683 | 0.9526 |
| Measurement | 0.2456 | 0.4944 | 0.9856 |
For the 6 cross tabulations where we did find statistical significance, we further examined the tables of Pearson residuals in an effort to understand what factor levels were associated with which clusters. One should compare Figure 7 to Tables 3 and 4, Figure 9 to Tables 5 and 6, and Figure 11 to Tables 7 and 8. This analysis allowed us to separate and combine the effects of each of three devices, each of the four probes, and each of the their combinations. Table 3 shows the Pearson residuals for the cross tabulation of Fast-EEM device with the frosted cuvette clusters and Table 4 shows the Pearson residuals for the cross tabulation of the four probes with the frosted cuvette clusters. We look for large positive Pearson residuals indicating a combination of device and cluster which occurred frequently. Pearson residuals larger than 1.645 would be considered individually statistically significant. The clusters are numbered row-wise to match with the plot of the cluster means presented previously. Thus, cluster 1 (whose mean is the leftmost subplot in the top row of figure 7) is associated with the BCCA device. This cluster mainly shows noisy horizontal bands and we believe these are due to power saturation. Clusters 2 and 3 are strongly associated with the MDA device; the cluster means are plotted in the middle and rightmost subplots of the top row of 7. They mainly show some high fluorescence intensity around emission wavelength 450 nm for excitation wavelengths from 350–400 nm; we believe this is due to autofluorescence inside the device. Cluster 4 (the lone plot in the second row of 7) is associated primarily with the second set of measurements at LBJ. This cluster has a mean spectrum with relatively little structure, especially compared with clusters 2 and 3. Looking now at the probe data in Table 4, we note that the MDA2 probe in cluster 2, the BCCA probe in cluster 3 and the MDA1 probe in cluster 4 account for some of the variation in the images. These analyses suggest that there are some differences amongst the three devices, amongst the four probes, and there exist the possibility of device/probe interactions. These will not be an issue for patient measurements because of processing, which was not performed on these data, which was not performed on these data; however understanding measurement error helps determine how to process data.
Table 3.
Pearson residuals for the cross tabulation of Fast-EEM box with Frosted Cuvette cluster.
| Frosted Cuvette Cluster | ||||
|---|---|---|---|---|
| 1 | 2 | 3 | 4 | |
| 1. MDA | −0.7620 | 6.9122 | 6.4984 | −5.6059 |
| 2A: LBJ 1 | −0.8347 | −1.7557 | 1.7039 | −0.2933 |
| 2B: LBJ 2 | −1.0223 | −2.3351 | −3.9610 | 3.0104 |
| 3. BCCA | 2.8219 | −1.7184 | −2.8243 | 1.7483 |
Table 4.
Pearson residuals for the cross tabulation of probe with Frosted Cuvette cluster.
| Frosted Cuvette Cluster | ||||
|---|---|---|---|---|
| 1 | 2 | 3 | 4 | |
| 1. MDA1 | 0.5332 | −2.0328 | −3.3263 | 2.3877 |
| 2. MDA2 | −0.8289 | 6.0145 | −3.3735 | 0.0863 |
| 3. LBJ | −0.9228 | −2.4416 | 1.2163 | 0.1959 |
| 4. BCCA | 1.2098 | −1.2542 | 4.5321 | −2.2361 |
Table 5.
Pearson residuals for the cross tabulation of Fast-EEM box with H2O cluster.
| H2O Cluster | |||||
|---|---|---|---|---|---|
| 1 | 2 | 3 | 4 | 5 | |
| 1. MDA | 9.3896 | 6.1777 | −6.3196 | −0.6202 | −0.4385 |
| 2A: LBJ 1 | −2.0349 | 1.4792 | 0.1909 | −0.6794 | −0.4804 |
| 2B: LBJ 2 | −3.3798 | −3.8309 | 3.1604 | −0.8321 | −0.5883 |
| 3. BCCA | −2.3972 | −2.4268 | 1.7074 | 2.2646 | 1.6013 |
Table 6.
Pearson residuals for the cross tabulation of probe with H2O cluster.
| H2O Cluster | |||||
|---|---|---|---|---|---|
| 1 | 2 | 3 | 4 | 5 | |
| 1. MDA1 | −2.1464 | −0.4520 | 1.1118 | −0.6253 | −0.4422 |
| 2. MDA2 | 3.7631 | −3.0277 | 0.0530 | −0.6794 | −0.4804 |
| 3. LBJ | 0.8430 | −2.3491 | 0.7392 | 0.5686 | −0.5341 |
| 4. BCCA | −2.4371 | 5.4162 | −1.6978 | 0.5570 | 1.3248 |
Table 7.
Pearson residuals for the cross tabulation of Fast-EEM box with Rhodamine cluster.
| Rhodamine Cluster | |||
|---|---|---|---|
| 1 | 2 | 3 | |
| 1. MDA | 7.4209 | 1.6635 | −4.9087 |
| 2A: LBJ 1 | 1.0459 | −2.3022 | 0.6889 |
| 2B: LBJ 2 | −3.6941 | 1.0132 | 1.4413 |
| 3. BCCA | −3.6332 | −0.3928 | 2.1737 |
Table 8.
Pearson residuals for the cross tabulation of probe with Rhodamine cluster.
| Rhodamine Cluster | |||
|---|---|---|---|
| 1 | 2 | 3 | |
| 1. MDA1 | −3.3714 | −3.4020 | 3.6705 |
| 2. MDA2 | 1.3812 | −3.6405 | 1.2365 |
| 3. LBJ | −3.9009 | 1.3990 | 1.3428 |
| 4. BCCA | 5.5042 | 4.8790 | −5.6250 |
In Figure 9 and Tables 5 and 6, we examine clusters of H20 measurements. In Figure 11 and Table 7 and 8 we examine cluster of rhodamine measurements. In sum, the MDA device and BCCA probe combination is significant 4 times; the BCCA device alone is significant 3 times, the BCCA device in combination with the MDA1 probe is significant 2 times, and the MDA device with the MDA2 probe is significant 2 times.
3.4 MANOVA analysis and proportion of variance
In Table 9 we present the results of the MANOVA analysis for each of sets of measurements of the standards trays. These results are presented so that all the measurements (by device, by probe, by standard, by day, and by time) are analyzed. Once again, the standards trays, date, and measurement time, are not statistically significantly different. The p values in the final column demonstrate that the device and probe account for the variability. We then asked how much variability can be explained by the devices and probes. In Table 10, the proportion of variance is presented. Herein, the data are reduced to principal components. The devices account for 22% of the variance noted in frosted cuvette measurements, 17% of the water measurements, and 33% of rhodamine measurements. The probes account for only 9% of the frosted cuvette variance, 2% of water measurements, but 39% of rhodamine measurements. Thus some of the rhodamine variance is accounted for by the device and the probe.
Table 9.
Results of the MANOVA analyses for each of the three standards.
| Frosted Cuvette | ||||||
|---|---|---|---|---|---|---|
| Df | Wilks | approx F | num Df | den Df | Pr(>F) | |
| Box | 3 | 0.0703 | 41.6202 | 30 | 848.9481 | 1.16E-144 |
| Probe | 3 | 0.2253 | 18.7193 | 30 | 848.9481 | 6.05E-074 |
| Standards Tray | 2 | 0.9324 | 1.0291 | 20 | 578.0000 | 0.4248 |
| Date | 1 | 0.9592 | 1.2280 | 10 | 289.0000 | 0.2725 |
| Measurement | 2 | 0.9449 | 0.8310 | 20 | 578.0000 | 0.6763 |
| H2O | ||||||
| Box | 3 | 0.2038 | 20.4979 | 30 | 854.8185 | 1.32E-080 |
| Probe | 3 | 0.5238 | 7.0231 | 30 | 854.8185 | 2.03E-025 |
| Standards Tray | 2 | 0.9308 | 1.0625 | 20 | 582.0000 | 0.3859 |
| Date | 1 | 0.9617 | 1.1604 | 10 | 291.0000 | 0.3175 |
| Measurement | 2 | 0.9435 | 0.8594 | 20 | 582.0000 | 0.6400 |
| Rhodamine | ||||||
| Box | 3 | 0.0915 | 34.3815 | 30 | 819.5961 | 1.62E-123 |
| Probe | 3 | 0.1328 | 27.0255 | 30 | 819.5961 | 1.30E-101 |
| Standards Tray | 2 | 0.9091 | 1.3612 | 20 | 558.0000 | 0.1351 |
| Date | 1 | 0.9764 | 0.6735 | 10 | 279.0000 | 0.7488 |
| Measurement | 2 | 0.9101 | 1.3463 | 20 | 558.0000 | 0.1434 |
Table 10.
Proportion of variance explained. The first row shows the overall proportion of variance explained by the first 10 principal components. The second and third rows show the proportion of variance explained by the Fast-EEM Box and Probe factors. The proportions in the second and third rows are out of the total variance explained by the first 10 principal components.
| Standard | |||
|---|---|---|---|
| Frosted Cuvette | H2O | Rhodamine | |
| PCA overall | 0.8035 | 0.6659 | 0.9997 |
| Fast-EEM Box | 0.2255 | 0.1664 | 0.3260 |
| Probe | 0.0939 | 0.0203 | 0.3901 |
DISCUSSSION
There are insufficient experiments comparing and calibrating medical devices. Measurement error has been a significant problem in the output of complex data. The measurements of DNA, RNA, and proteins generated using different manufacturer’s devices and protocols are the subject of much controversy [8–16]. Moreover, it is often difficult to repeat measurements when the sample being measured, such as DNA, is a small quantity and can be used up in the measurement.
We are generating excitation-emission matrices that are 3-dimensional. These data are complex to measure and analyze. While the data can be reduced using principal components, checking the data before reducing it is wise. In this experiment, our aim was to see the differences that could be generated by each component that varied in our clinical trials. We believe this type of study should be repeated every six months during the trials. In this experiment, we verified using unprocessed data, that there are subtle differences amongst the three devices, amongst the four probes, and within 4 of the 12 possible combinations. We also learned that were not statistically significant differences amongst the three sets of standards used, when measured with each device/probe combination. We also learned that there were not meaningful day to day differences in measurements. We learned that a set of measurements taken over days 1–8 resembles those taken days 25–32. We learned that the time of day did not affect measurements in any of the three sites. We learned that the order, 1–6 of the measurements also did not affect the measurements.
This investigation represents a significant effort of time and resources. More studies are needed of the sources of measurement variability for medical devices. This study allowed us to examine the major components of the spectroscopic instrumentation we are using for large clinical trials for detecting cervical neoplasia. The results of this analysis show that the largest sources of variability are due to the devices and probes. In subsequent investigations, we plan to show the analysis of data that is processed to minimize the effect of the devices. We hope that this will lead to a device that is sufficiently robust to go to the developing world.
References
- 1.Romer TJ, Fitzmaurice M, Cothren RM, Richards-Kortum R, Petras R, Sivak MV, Jr, Kramer JR., Jr Laser-induced fluorescence microscopy of normal colon and dysplasia in colonic adenomas: implications fro spectroscopic diagnosis. Am J Gastroenterol. 1995;90(1):81–7. [PubMed] [Google Scholar]
- 2.Richards-Kortum R, Sevick-Muraca E. Quantitative optical spectroscopy for tissue diagnosis. Annu Rev Phys Chem. 1996;47:555–606. doi: 10.1146/annurev.physchem.47.1.555. [DOI] [PubMed] [Google Scholar]
- 3.Ramanujan N, Mitchell MF, Mahadevan-Jansen A, Thomsen SL, Staerkel G, Malpica A, Wright T, Atkinson N, Richards-Kortum R. Cervical precancer detectjion using a multivariate statistical algorithm based on laser-induced fluorescence at multiple excitation wavelengths. Photochem Photobiol. 1996. pp. 720–35. [DOI] [PubMed]
- 4.Svistum E, Alizadeh-Naderi R, El-Naggar A, Jacob R, Gillenwater A, Richards-Kortum R. Vision enhancement system for detection of oral cavity neoplasia based on autofluorescence. Head Neck. 2004;26(3):205–15. doi: 10.1002/hed.10381. [DOI] [PubMed] [Google Scholar]
- 5.Chang SK, Mirabel YN, Atkinson EN, Cox D, Malpica A, Follen M, Richards-Kortum R. Combined relectance and fluorescence spectroscopy for in vivo detection of cervical pre-cancer. J Biomed Opt 2005 10 (2) 24031. [DOI] [PubMed]
- 6.Rencher, AC. Methods of Multivariate Analysis. Second Edition. New York. Wiley. 2002
- 7.Agresti, A. Categorical Data Analysis. Second Edition. New York. Wiley. 2002
- 8.Baggerly KA, Morris JS, Edmonson sR, Baggerly KA. Serum proteomics profiling—a young technology begins to mature. Nat Biotechnol. 2005(3):23. 291–2. doi: 10.1038/nbt0305-291. [DOI] [PubMed] [Google Scholar]
- 9.Baggerly KA, Morris JS, Coombes KR. Reproduciablity of SELDI-TOF protein patterns in serum: comparing datasets from different experiments. Bioinformatics. 2004(5):20. 777–85. doi: 10.1093/bioinformatics/btg484. [DOI] [PubMed] [Google Scholar]
- 10.Hess KR, Ahang W, Baggerly KA, Stiver DN, Coombes KR. Microarrays: handling the deluge of data and extracting reliable information. Trends Biotechnol. 2001;19 (11):463–8. doi: 10.1016/s0167-7799(01)01792-9. [DOI] [PubMed] [Google Scholar]
- 11.Coombes KR, Highsmith WE, Krogmann TA, Baggerly KA, Stiver DN, Abruzzo LV. Identifying and quantifying sources of variation in microarray data using high density cDNA membrane arrays. J Comput Biol. pp. 9pp. 655–69. [DOI] [PubMed]
- 12.Ramdas L, Coombes KR, Baggerly K, Abruzzo L, Highsmith WE, Krogmann T, Hamilton SR, Zhang W. Sources of nonlinearity in cDNA microarray expression experiments. Genome Biol. 2001;2(11) doi: 10.1186/gb-2001-2-11-research0047. Epub. [DOI] [PMC free article] [PubMed] [Google Scholar]
- 13.Coombes KR, Tsavachidis S, Morris JS, Baggerly KA, Hung MC, Kuerer HM: Improved peak detection and quantification of mass spectrometry data acquired from surface-enhanced laser desorption and ionization by denoising spectra with the undecimated discrete wavelet transform. UTMDABTR-001-04 (pdf) at M. D. Anderson website for research in biomathematics. [DOI] [PubMed]
- 14.Baggerly KA, Morris JS, Edmonson S, Coombes KR: Signal in noise: Can experimental bias explain some results of serum proteomics tests for ovarian cancer? UTMDABTR-008-04 (pdf) JNCI 2005 97(6) 307–9. [DOI] [PubMed]
- 15.Guillaud M, Cox D, Adler-Storthz K, Malpica A, Staerkel G, Matisic J, Van Niekerk D, Poulin N, Follen M, MacAulay C. Quantitative Histopathological Analysis of Cervical Intraepithelial Neoplasia Sections: Methodological Issues. Cellular Oncology. 2004;26:31–43. doi: 10.1155/2004/238769. [DOI] [PMC free article] [PubMed] [Google Scholar]
- 16.Chiu D, Guillaud M, Cox D, Follen M, MacAulay C. Quality Assurance system using statistical process control: An implementation for image cytometry. Cellular Oncology. 2004;00:1–17. doi: 10.1155/2004/794021. [DOI] [PMC free article] [PubMed] [Google Scholar]


