Fig 1.

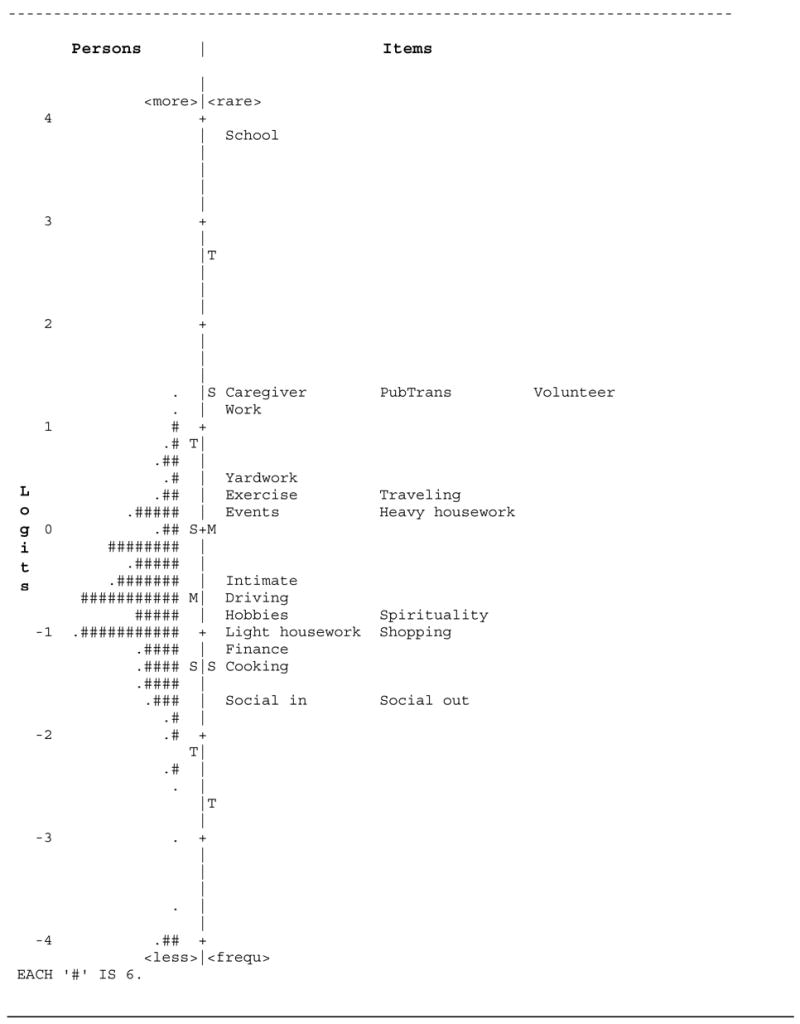
Rasch person and item frequency map, in logits, for the 20 PAR-PRO items. Values reported for both persons and items. Legend: M, mean; S, 1 standard deviation; T, 2 standard deviations.

Rasch person and item frequency map, in logits, for the 20 PAR-PRO items. Values reported for both persons and items. Legend: M, mean; S, 1 standard deviation; T, 2 standard deviations.