
Figure 1.
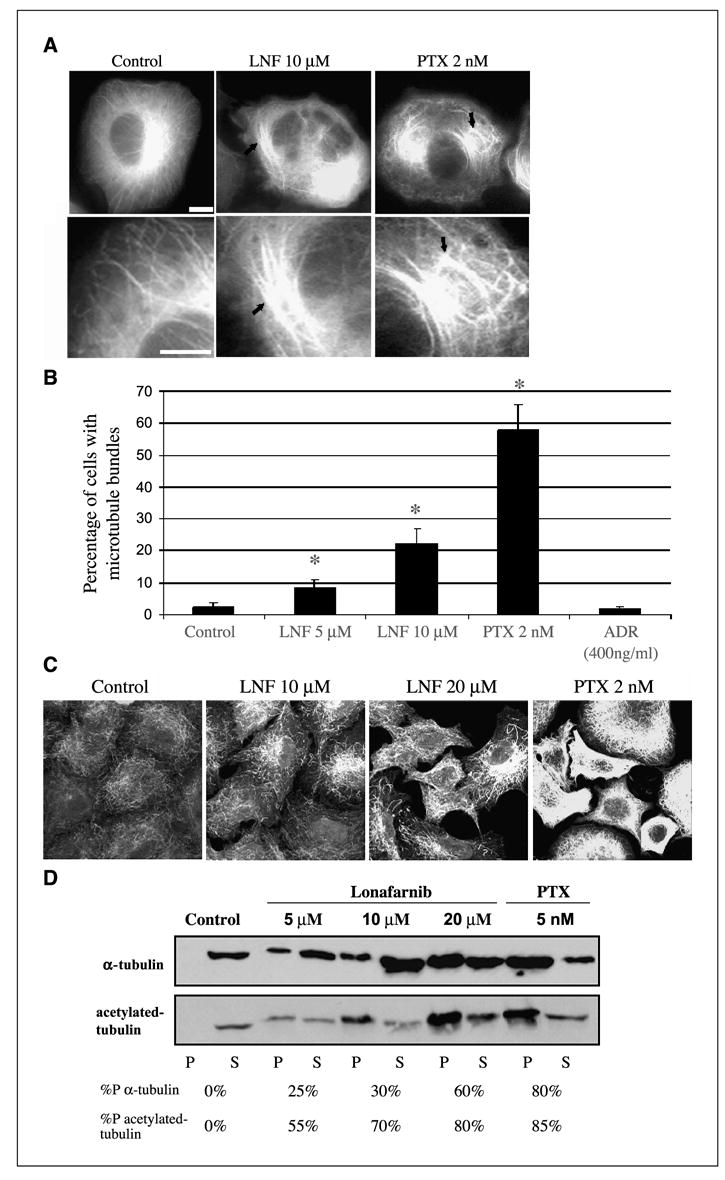
Lonafarnib treatment alters microtubule structure and increases tubulin acetylation. A, MCF-7 breast cancer cells stably expressing GFP: α -tubulin were observed using live-cell fluorescence microscopy following the indicated drug treatments for 48 hours. Solid arrows, microtubule bundling. Bottom row displays higher magnification of microtubules shown in the top row. Bar, 10 − m. B, number of cells containing microtubule bundles following drug treatments shown in A. Asterisks denote a significant difference in the percentage of cells having microtubule bundles compared with control (P < 0.05). Bars, ±SD. C, A549 cells were treated with lonafarnib (LNF) for 48 hours and microtubules were visualized by immunofluorescence labeling using an antibody against acetylated α -tubulin. Treatment with paclitaxel (PTX) is included as a positive control. Bar, 10 − m. D, Western blot analysis against total α -tubulin (top) and acetylated tubulin (bottom) on the polymerized (P) and soluble (S) fractions of protein lysates from A549 cells treated with the indicated drug concentrations for 48 hours. %P, relative percentage of polymerized tubulin for each drug treatment.