
Figure 2.
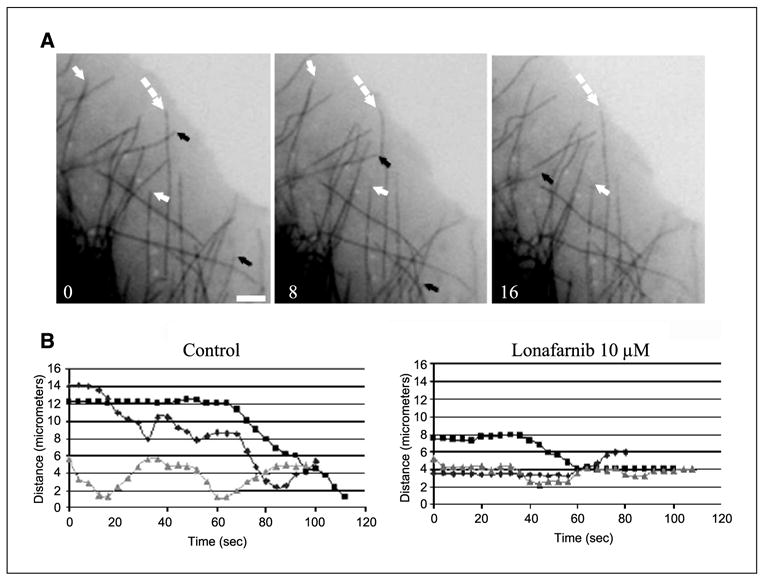
Lonafarnib treatment suppresses microtubule dynamics in living MCF-7 cells. A, time lapse sequences of microtubules in untreated living MCF-7 cells stably expressing GFP: α -tubulin. Arrows depict dynamic microtubules that change length over the course of 16 seconds: black arrows, microtubule shortening; white arrows, microtubule growth; dashed arrows, paused microtubules. Bar, 5 − m. B, individual microtubule life history plots from control untreated cells or cells treated with 10 − mol/L lonafarnib for 48 hours. Growth events are seen as an increase in distance from a fixed point (y axis) over time (x axis) and shortening events show a decrease in distance over time.