
Figure 2.
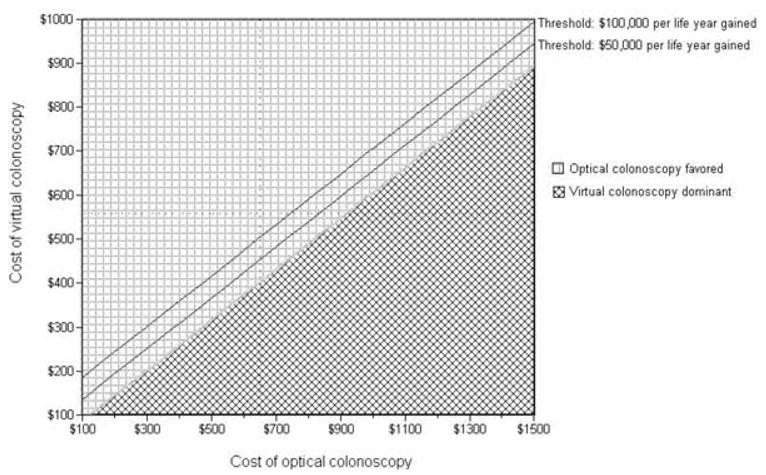
Two-way sensitivity analysis: Cost of virtual versus optical colonoscopy. The graph represents the incremental cost-effectiveness of 3-D CT colonography every 5 yr versus optical colonoscopy every 10 yr. 3-D CT colonography is more effective than optical colonoscopy. The diamond-checked area shows a region where CT colonography is less expensive (and thus dominant, being more effective and less expensive) than optical colonoscopy. The square-checked area shows a region where CT colonography costs more than optical colonoscopy; the solid lines show two commonly cited thresholds of cost-effectiveness ($50,000 and $100,000 per life-year gained). The costs used in the base case analysis are represented by the dotted lines (incremental cost-effectiveness ratio = $156,000 per life-year gained).