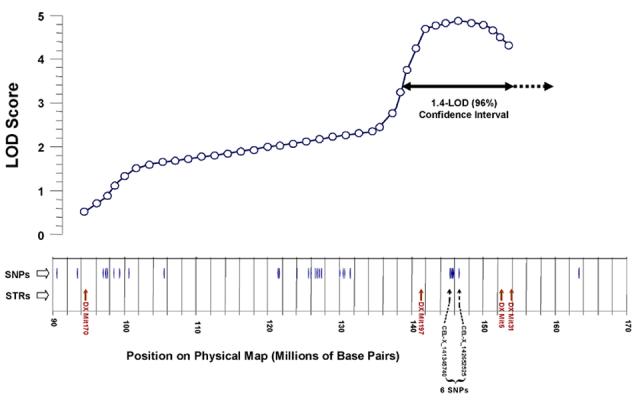
Figure 5.

Distribution of single-nucleotide polymorphisms, distinguishing between mouse strains AKR/J and SAMP6, near the X-chromosome QTL peak. Informative SNPs are positioned with reference to the physical map of the murine X chromosome (NCBI Build 34.1), as are short-tandem-repeat (STR) polymorphisms used in interval mapping. The results of composite interval mapping in Cross 1 are depicted above these lines; selected functional-candidate genes are indicated for reference. The x-axis has been distorted slightly in aligning genetic and physical maps. A two-headed horizontal arrow below the curve marks the ∼96% confidence interval for QTL position.
