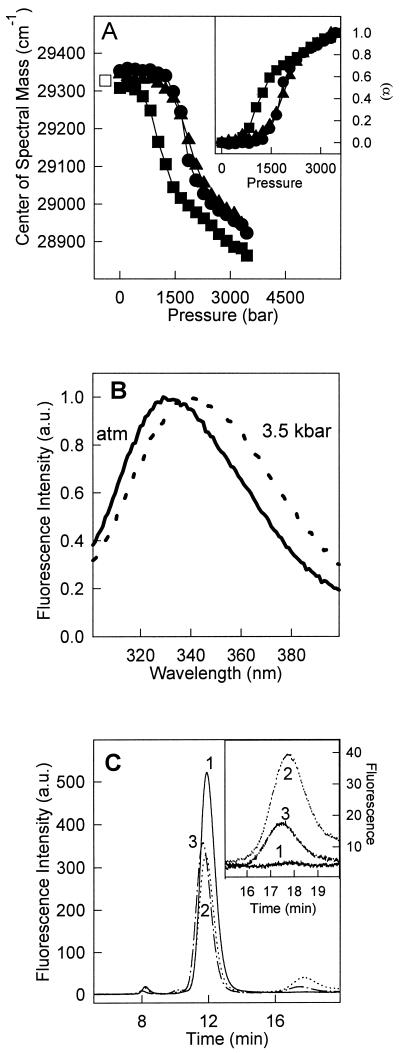
Figure 1.
Pressure-induced dissociation-unfolding of TTR. (A) The center of mass of tryptophan emission was used to follow dissociation-denaturation of TTR as a function of pressure at pH 5.6 and 37°C (●), at pH 5.6 and 1°C (■), and at pH 7.5 and 37°C (▴). Protein concentration was 1 μM. The center of mass obtained after decompression was identical on all three cases (□). (Inset) The extent of dissociation-unfolding (α) was calculated as described in Experimental Procedures (Eq. 2) by using the center of mass values presented in A. The symbols used in the curves were the same. (B) Normalized fluorescence emission spectra of tryptophan at pH 5.6, 1°C at (solid line) atmospheric pressure or (dotted line) at 3.5 kbar. (C) Size exclusion chromatography of TTR after a cycle of compression. TTR (1 μM) was pressurized at pH 5.6 for 60 min at 1°C. After decompression at 1°C, the sample was injected immediately into the HPLC (chromatogram 2) or kept on ice for 30 min after decompression (chromatogram 3). The control (1 h at pH 5.6 not subjected to pressure) is shown in chromatogram 1. (Inset) An expansion of the monomer peak in these three conditions. The elution was followed by setting the excitation at 280 nm and collecting the emission at 330 nm.

