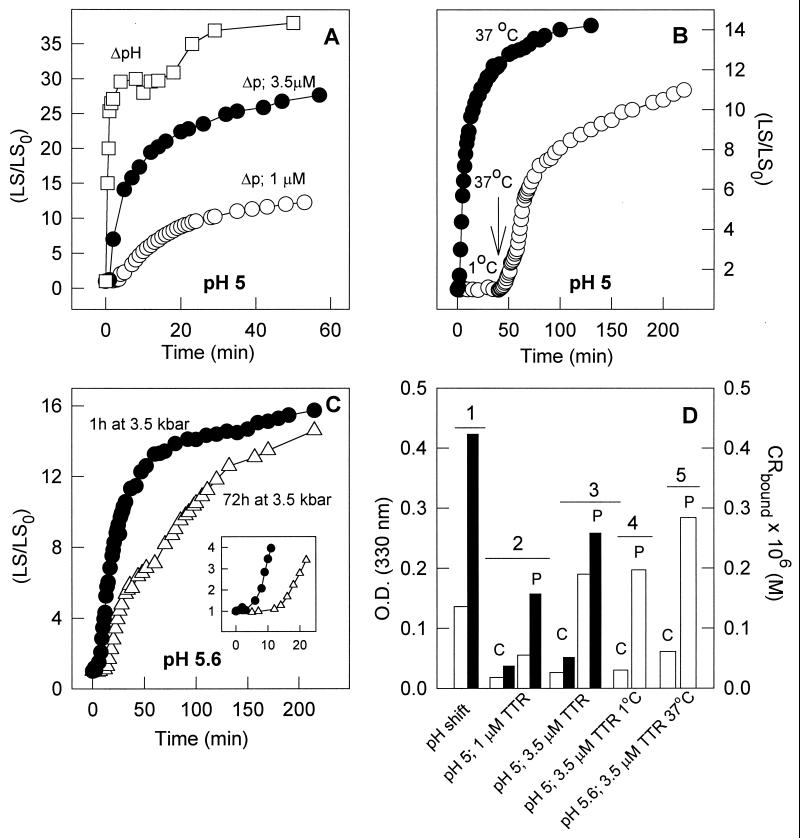
Figure 2.
Pressure-induced aggregation of TTR as measured by light scattering. (A) At pH 5, 3.5 μM (●) or 1 μM (○) TTR was compressed at 3.5 kbar for 60 min at 37°C. Pressure was released at time 0 on the graph, and the light scattering was measured. The extent of aggregation is plotted as the ratio between light scattering at any given time (LS) and the light scattering value obtained immediately after decompression (LS0). Also shown for comparison is the increase in LS when 3.5 μM TTR was incubated at atmospheric pressure at pH 2.0 and then transferred to pH 3.7 (ΔpH, □). (B) At pH 5.0, 3.5 μM TTR was compressed at 3.5 kbar for 60 min at 37°C (●) or 1°C (○). After the return to atmospheric pressure, light scattering was measured with time. At the arrow, the sample that was pressurized at 1°C was heated up to 37°C, triggering the aggregation reaction. (C) At pH 5.6, 3.5 μM TTR was compressed at 37°C for 60 min (●) or 72 h (▵) and then pressure was released and aggregation was followed by the LS increase. Light scattering was measured by exciting the samples at 320 nm and collecting the scattered light from 315 to 325 nm. Because experiments were performed inside the pressure cell, no stirring was allowed. (D) At the end, experiments like those in A–C were removed from the pressure cell and the absorbance was measured at 330 nm (hollow bars) or Congo red binding (filled bars) was evaluated. The pressurized samples are marked P; the controls, C. Condition 1, ΔpH; condition 2, pH 5 and 1 μM TTR, 37°C; condition 3, pH 5 and 3.5 μM TTR, 37°C; condition 4, pH 5 and 3.5 μM TTR, 1°C → 37°C; condition 5, pH 5.6 and 3.5 μM TTR, 37°C.

