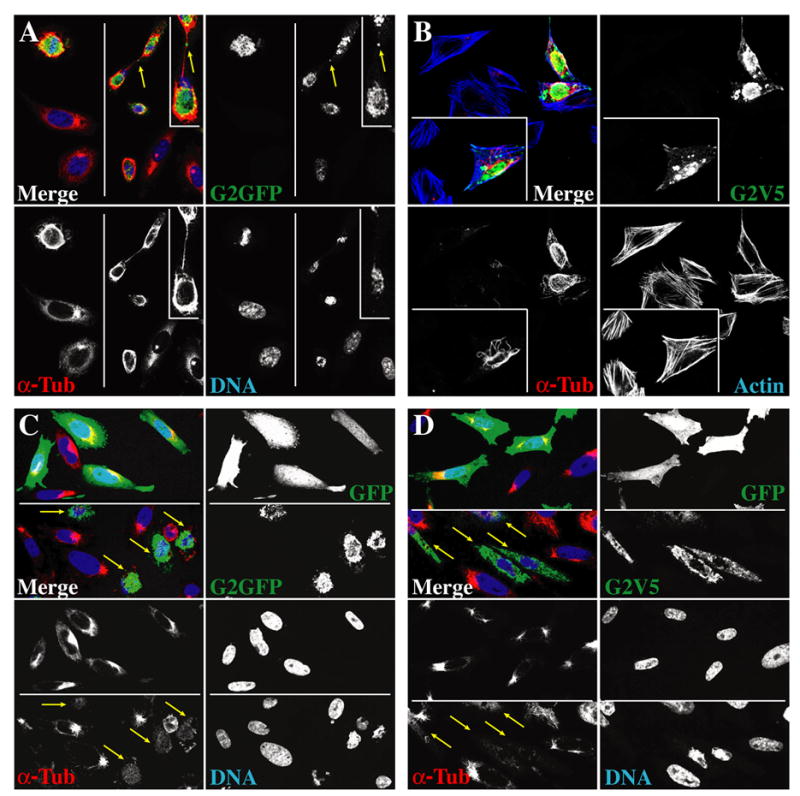
Fig. 1. High-level ectopic cyclin G2 expression alters microtubule stability.

(A–D) Micrograph images of 0.3 μM optical sections of CHO cells transfected with pcDNA3 expression constructs encoding G2-GFP (A, C top panel, lower right), G2V5His (B, D top panel, lower right), or GFP alone (C, D top panels, upper right) obtained by confocal immunofluorescence microscopy. (A) Control cells and those expressing cyclin G2-GFP were treated with 1 μM nocodazole for 15 minutes followed by washout and a three-minute release into drug free medium prior to fixation with 4% paraformaldehyde. Nuclear DNA was stained with TOTO-3 and MTs in fixed cells were labeled with the DM1A mouse anti-α-tubulin antibody. Images collected from two different fields of the same slide are shown on left and right. The arrow indicates a bright dot of cyclin G2 associated with the mid-zone MT-bridge of cells undergoing cytokinesis. The inset shows a larger magnification of this region. (B) Cells expressing cyclin G2-V5His were treated with nocodazole for 30 minutes, pre-extracted with Triton X-100 in PHEM buffer, rinsed and fixed with methanol. F-Actin is detected with fluorescently labeled phalloidin. The inset shows cells from another field of the same slide. (C, D) Cultures were transfected with cyclin G2-GFP (C, bottom field in each top panel), G2V5His (D, bottom field in each top panel) or GFP (C, D, top fields) and treated for 2 hours with nocodazole, followed by rinse and release into drug-free medium for 3 minutes, and then fixed with paraformaldehyde. Cyclin G2V5His was detected with rabbit anti-cyclin G2 antibody (green), followed by FITC-conjugated donkey anti-rabbit IgG. DNA (right fields in each bottom panel) and MTs (left fields in each bottom panel) were stained as above. Immuno-signals are shown pseudo colored in the merged panels as indicated by the font color of the single channel labels. Single channel signals are shown in black and white for better contrast.
