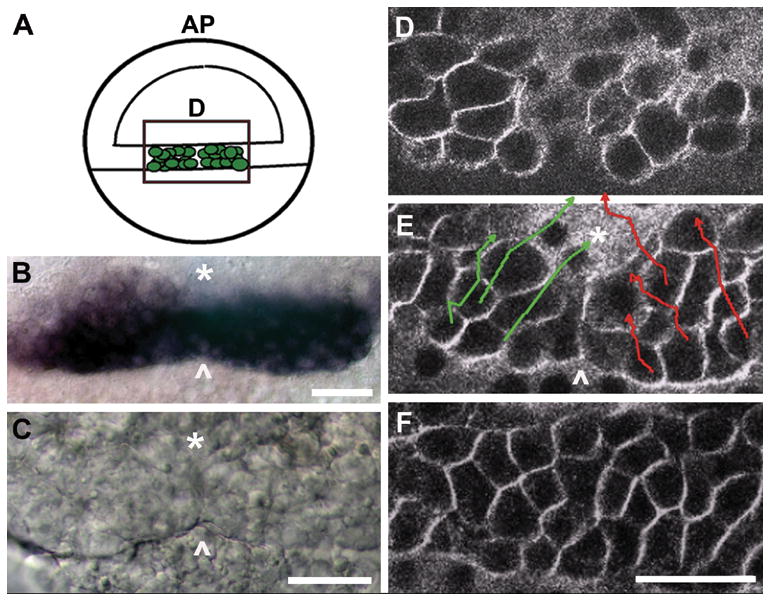
Fig. 1. The early presumptive prechordal plate is initially comprised of two spatially distinct domains that merge into a singular, midline field.

(A) Schematic of the embryo at gastrula onset (50% epiboly, S-D 1:15), representing the newly internalized presumptive prechordal plate, depicted as green cells within the rectangle. Images in B–D correspond to the boxed region represented in the schematic. Green, presumptive prechordal plate cells are located within the germ ring. Blastoderm is located on the top half of the schematized 50% epiboly embryo. AP: animal pole. D: dorsal.
(B) gsc expression at 45% epiboly (S-D 1:10). Arrowhead marks the position of the demarcation.
(C) Nomarski DIC image at 45% epiboly (S-D 1:10). The boundary between the initially distinct domains is represented by an asterisk and the arrowhead marks the position of the demarcation.
(D–F) Cells at the dorsal margin were tracked for a period of one hour, from just prior to 40% epiboly (S-D 0:45) to 55% epiboly (S-D 1:50) using FM-4-64 which labels cell membranes making it possible to distinguish individual cells. Image in D shows the first frame of the recording, with newly internalized cells forming two separate inward bulges into the yolk syncitial layer. Tracks in E represent trajectories of individual cells over the 65 minute period. The end time point of each track is represented by an arrow. Image in E represents the 30 minute time point when the demarcation is evident (indicated with an arrowhead. F shows the final frame of the recording at which time the demarcation is erased. flh-GFP expression is enhanced at the dorsal margin and was used to mount embryos dorsally prior to the appearance of the shield. The asterisk marks the position of the dorsal midline. Arrowhead marks the position of the demarcation. Scale bars: 50 μm.
