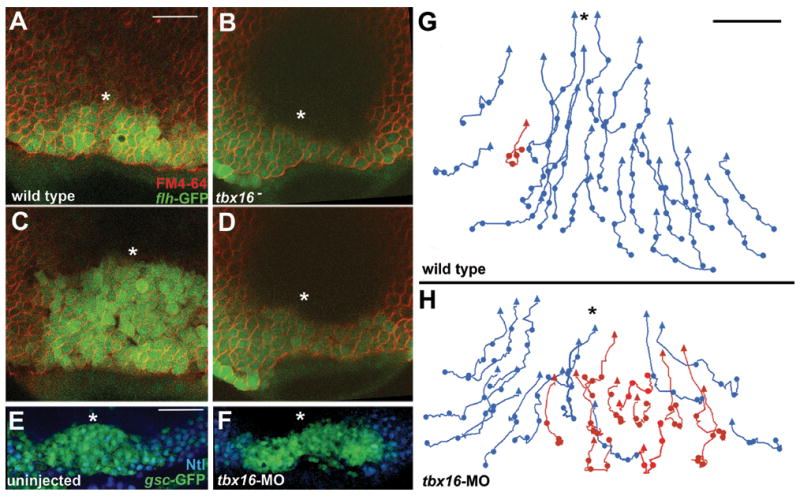
Fig. 2. Presumptive prechordal plate coalescence is disrupted in tbx16 mutants and tbx16-MO embryos.

(A–D) Recordings of movements of the presumptive prechordal plate were made starting at S-D 1:15. flh-GFP marks internalized cells at the midline. (A) Wild-type embryo is shown at time 0:00. Note that unlike endogenous flh expression, flh-GFP is expressed in both presumptive prechordal plate and notochord cells at these timepoints. FM4-64 was used to label the membranes of cells. The asterisk indicates the position of the midline. Dorsal view with animal pole up (A–H).
(B) Panel shows a tbx16- embryo at time 0:00. tbx16(b104) was used in all experiments. We observed a similar phenotype in tbx16-MO embryos.
(C) Panel shows the same wild-type embryo as in A at time 30:00.
(D) Panel shows the same tbx16- embryo as in B at time 30:00.
(E–F) Confocal section of a wild type embryo fixed shortly after the initiation of anterior presumptive prechordal plate translocation (S-D 1:25). Presumptive prechordal plate cells in (E) an uninjected embryo and (F) a tbx16-MO embryo were labeled with gsc-GFP (green) and Ntl expression (blue) visible in marginal cells adjacent to the presumptive prechordal plate.
(G–H) Shows tracks of cell movements during a 60 minute recording. Recording starts at 50% epiboly. Midline is represented with an asterisk. Tracks of an uninjected embryo (G) and a tbx16-MO embryo (H). Tracks displaying directed movement are color-coded blue and tracks displaying aberrant movement are color-coded red. Scale bar represents 100um in (A–F) and 50um in (G–H).
