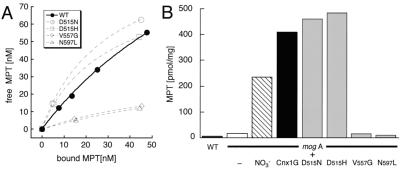
Figure 4.
MPT binding properties of wild-type and mutant Cnx1 G domains. (A) MPT binding curves of Cnx1G and all four mutant proteins. For the binding assays, 200 nM of purified protein was used. The amount of free MPT was plotted against the amount of protein-bound MPT and fitted by using Michaelis–Menten binding curves. The two points of each mutant curve were fitted in the same way for better visualization. (B) MPT content of E. coli wild-type strain RK4353 (WT), E. coli mogA mutant RK5206 (white bar) grown under aerobic growth conditions, E. coli mogA mutant RK5206 grown under nitrate reductase-inducing conditions (NO3−, striped bar), and E. coli mogA cells overexpressing Cnx1 G domain (Cnx1G, black bar) and the four G domain mutants (gray bars). MPT content was determined by FormA HPLC analysis.

