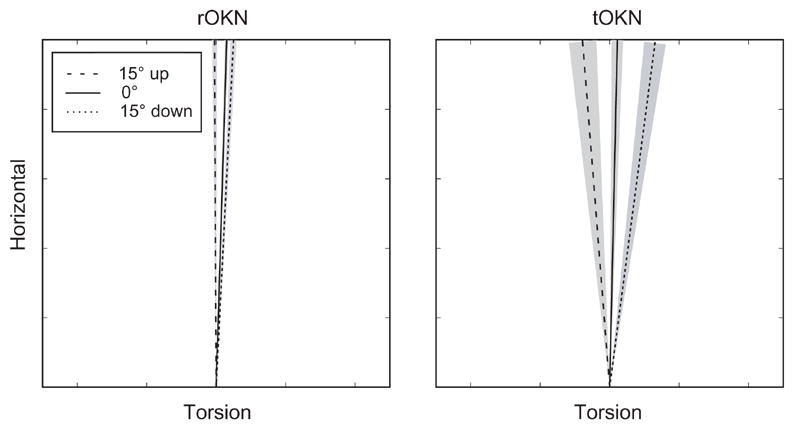
Figure 2.

Eye velocity axis as a function of orbital position for rOKN and tOKN (M2). Each line represents the mean axis (torsional vs. horizontal eye velocity) for all slow phases within a vertical position window of 5°, centered on the indicated position. The shaded areas show the 95% confidence intervals. Axes are shown in the coordinates of the coil frame (not in Listing’s coordinates), in order to allow direct comparison with the axis of the visual stimulus.
