
Figure 3.
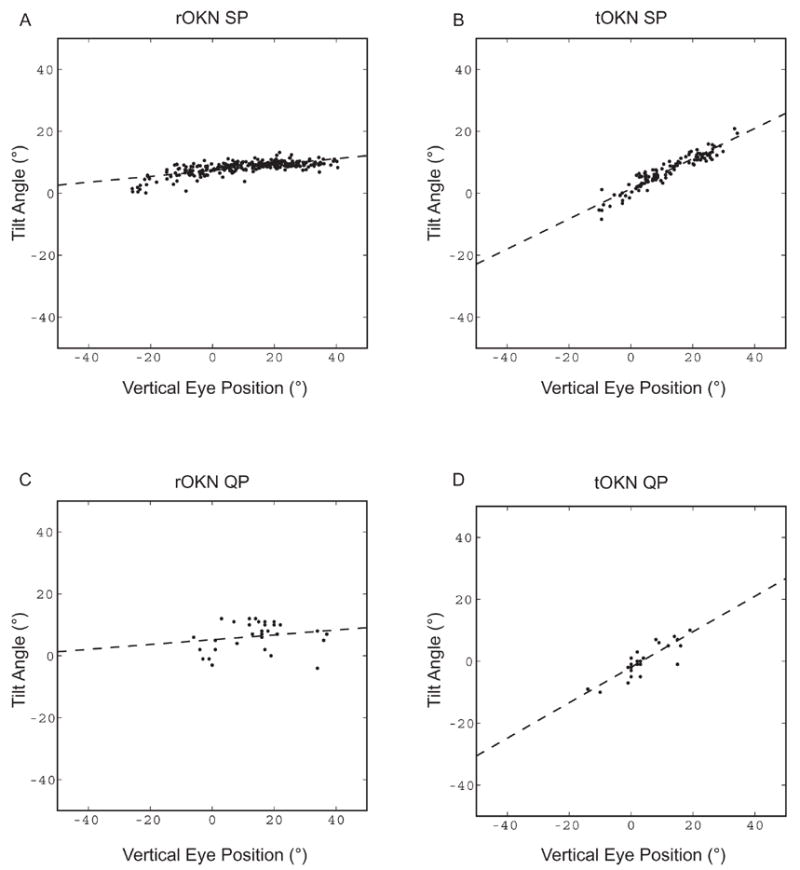
Examples of tilt-angle slope (TAS) calculations for (A) rOKN, and (B) tOKN, for rightward slow-phases in M1. For each slow phase, the tilt angle (arctangent of the ratio of median torsional to median horizontal eye velocity) is plotted as a function of median vertical eye position. The dashed line shows the result of a least-squares linear regression, the slope of which is the tilt-angle slope. (C) and (D): Calculation of TAS for quick phases. There is a smaller number of quick phases than slow phases, because quick phases that had peak vertical velocities exceeding 15% of the peak horizontal velocity were excluded from the analysis. For TAS calculations, data were expressed in Listing’s coordinates.