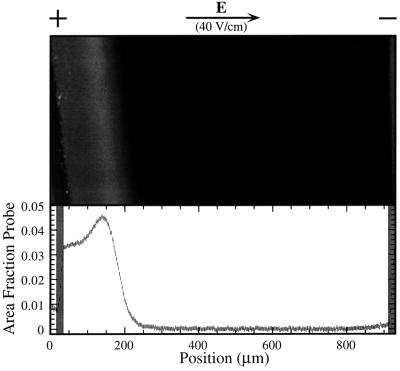
Figure 3.
Image of the steady-state concentration profile of NBD-PE in a mixture of cardiolipin and egg-PC taken with a Zeiss Axiovert 100 epifluorescence microscope equipped with a Princeton Instruments (Trenton, NJ) model TK512D back-illuminated charge-coupled device camera. This distribution was created with an applied field of ≈40 V/cm in a patch of membrane confined between scratch boundaries. Image analysis was used to obtain a quantitative trace of the profile, which is shown in the lower panel. The scale on this profile was calibrated against the fluorescence intensity from the uniform membrane (1% area fraction) before application of the field.

