
Figure 4.
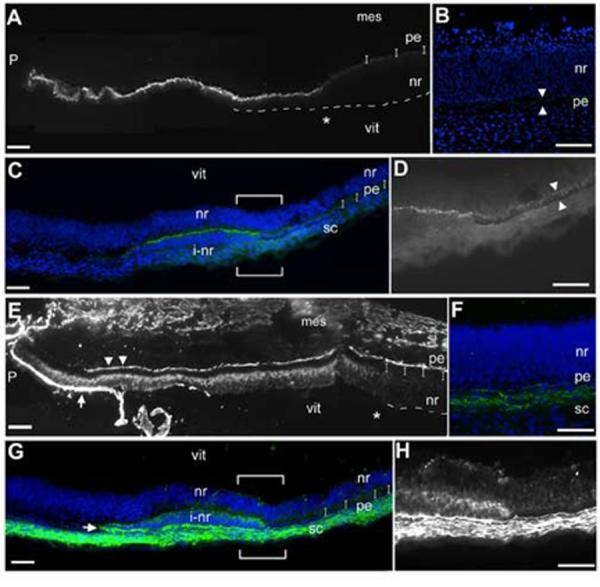
Expression of ciliary body proteins in transition zones.(A) Connexin43 immunohistochemistry shows that the protein is highly expressed at the margins of the optic cup and that expression drops off sharply at the future ora serrata (asterisk). Dashes outline the extent of neural retina and small brackets indicate where the pigmented epithelium is. (B) View of the posterior retina of the stained section in A; In comparison to the anterior margin, the pigmented epithelium expresses low levels of connexin43 (arrowheads) and the neural retina is completely negative. (C) In a small transition zone, connexin43 is highly expressed. Large brackets indicate the area shown in D. (D) Higher magnification of the border between pigmented and non-pigmented tissue in the transition zone shows that high connexin43 expression and a pigmented phenotype are mutually exclusive; pigmented epithelium expresses low levels of connexin (arrowheads). (E) Tenascin-C immunohistochemistry shows that the protein is expressed in the non-pigmented epithelium of the ciliary body. Bright staining on the basal surfaces of the pigmented epithelium (arrowheads) and at the margin (arrow) indicates sites of secretion. Expression drops off at the future ora serrata (asterisk). (F) A view of the posterior retina of the stained section in E: the neural retina is completely negative, while the sclera is positive. (G) In a small transition zone, adjacent to the section shown in C, tenascin-C is expressed within the non-pigmented tissue of the transition zone. Arrow indicates a staining that resembles secreted protein, as in E, arrow. Large brackets indicate the area shown in H. (H) Higher magnification of the border between pigmented epithelium and non-pigmented tissue. All tissue examined at e5. P: pupil opening, vit: vitreal opening, sc: forming sclera, other abbreviations as in Fig 1. Scale: bar=50μm.