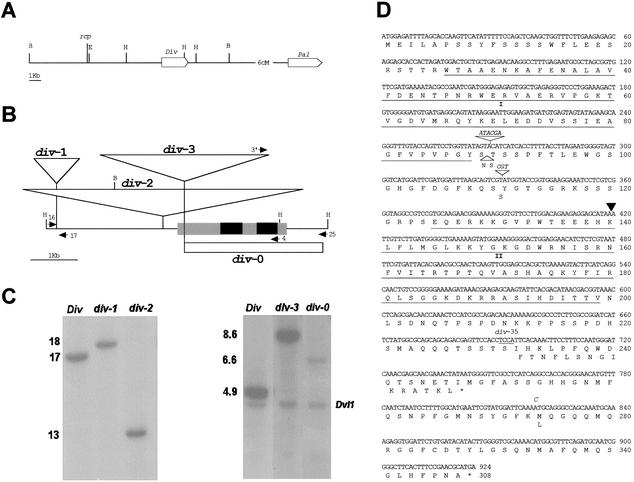
Figure 3.
The div locus and mutants. (A) Chromosomal positions of rcp, div, and pal. The boxes indicate genes and their orientations. Restriction sites are EcoRI (E), BamHI (B), and HindIII (H). (B) Maps of DIV and div alleles. Black boxes are coding segments and gray boxes transcribed nontranslated regions. Transcription is from left to right. Triangles represent transposons. The white box shows the deletion in div-0. Arrows represent oligonucleotides (see Materials and Methods). (C) Southern blots of genomic DNA from the alleles indicated above the lanes. BamHI digests were probed with the BamHI–EcoRI segment containing the rcp locus (left panel). HindIII digests were probed with a cDNA clone (right panel). The cDNA initiates 166 bp to the left of the Tam3 insertion site, thus detecting a faint 6.6-kb band in div-0. A segment of the DVL1 gene is detected in the right panel. (D) Sequences of wild type and div-35. The main sequence is that of DIV in line JI2. The black triangle shows the position of the intron. Insertions or substitutions in DIV-25 and div-35 (shown in italic) result in the amino acid changes indicated below the main sequence. The underlined TCCA sequence is deleted in div-35 with the resulting frame-shift shown below the main sequence. Underlined amino acid sequences contain the MYB domains (I and II).

