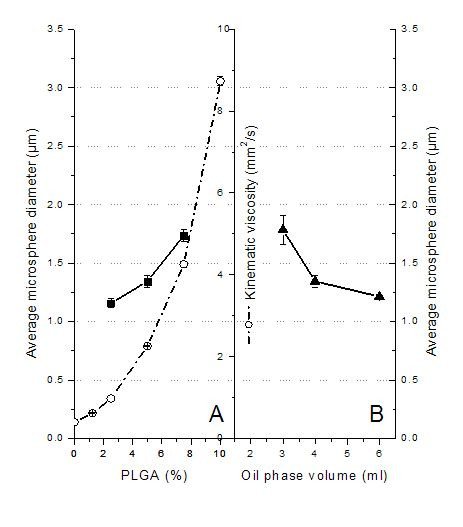
Figure 3.

Effect of formulation variables in oil phase. (A) Effect of PLGA concentration in oil phase on average microsphere diameter (▪, y-axis is to the left) and the relationship between PLGA concentration and kinematic viscosity (○, y-axis is to the right). (B) Effect of oil phase volume on average microsphere diameter (▲, y-axis is to the right).
