
Figure 2.
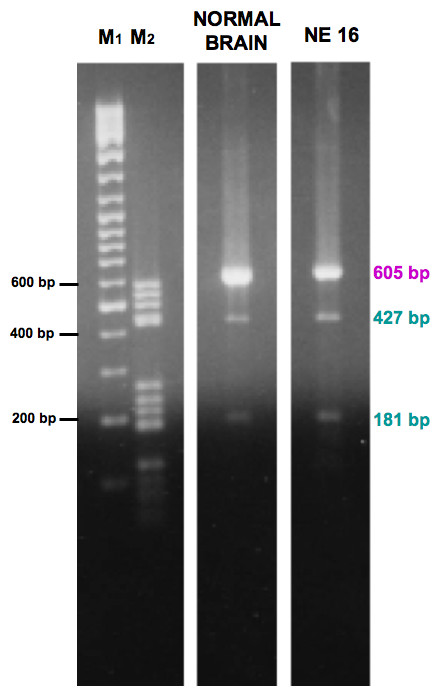
Enzymatic digestion of CYYR1 CDS RT-PCR products from normal brain and an NE tumor. Gel electrophoresis analysis of CYYR1 CDS RT-PCR products, from normal brain and NE 16, after PstI digestion. Expected size bands (CAG- form: 605 bp, CAG+ form: 427 bp and 181 bp) were obtained in both samples. M1: GeneRuler marker, 500 ng; M2: DNA M5 marker, 250 ng.