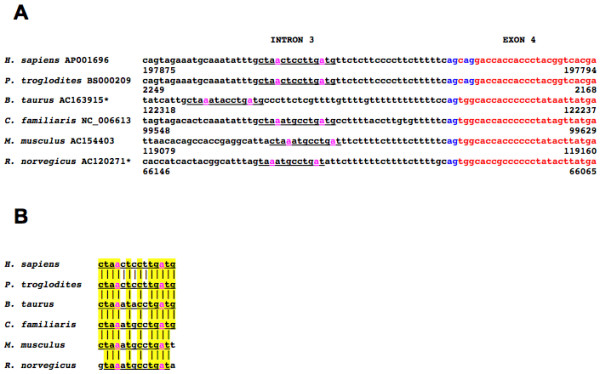
Figure 5.

CYYR1 intron 3/exon 4 boundary. Comparison of CYYR1 57 bases at 3' of intron 3 and 25 bases at 5' of exon 4 in some mammalian species. The symbol * indicates GenBank sequences from ''htgs'' (draft) division. In blue: splicing sites; in magenta: putative branch points (A). In B: comparison of the putative branch sites (the underscored regions in A); in yellow: high identity regions.
