Fig. 3.
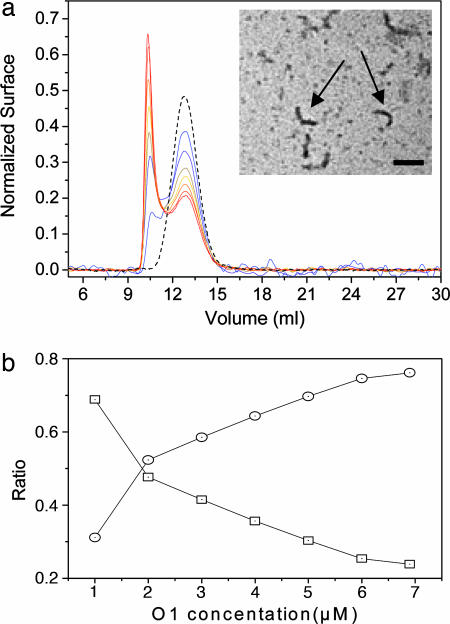
Generation of protofibrils by the O1 oligomer of OvPrP. (a) The experiment was performed with initial O1 concentrations (expressed in monomer equivalents) varying from 1 μM (blue line) to 7 μM (red line) with 1-μM steps. The dashed line represents the O1 profile at 7 μM before ultracentrifugation. The larger oligomer (P0) generated by ultracentrifugation had a fibrillar morphology, as seen by transmission EM. (Inset Scale bar: 0.2 μm.) (b) After chromatogram deconvolution variation of O1 (square) and P0 (circle) amounts were plotted as a function of O1 initial concentration. The hyperbolic variations of O1 and P0 as a function of the initial concentration of O1 suggested a seeding oligomerization process.

